Gentrification is changing Philadelphia, but it’s not the only force. According to a new report by Pew, 15 Philadelphia neighborhoods gentrified between 2000 and 2014 (experiencing at least a 10 percent increase in median income) while 10 times as many — 164 neighborhoods — experienced a significant decrease in median incomes. Other parts of the city saw rising real estate prices, increases in educational attainment, changing racial and ethnic makeup, but no increases in income, and thus did not meet the report’s definition of gentrification.
“Our goal with this analysis was to determine the incidence of gentrification in Philadelphia and place it in the context of other forms of neighborhood transformation,” said Larry Eichel, director of Pew’s Philadelphia research, in a statement. “The data indicate that, by our definition, gentrification is a relatively small part of the story for the city’s changing neighborhoods. But what happens in the areas that have gentrified, or are in the process of doing so, can have significant impact on communities.”
The report’s definition of gentrification is based on change in the majority of residents’ income status: going from a predominantly low-income population in 2000 to a significantly higher-income population in 2014, according to the Census Bureau’s American Community Survey. To be identified as gentrifying, a census tract’s median household income needed to be below 80 percent of regional median income in 2000, increase by at least 10 percent between 2000 and 2014 (a period during which citywide median income actually fell by about 10 percent), and exceed the citywide median income in 2014, which was $37,460. Last week, the NYU Furman Center released a report after studying New York City gentrification based on a definition around rent increases.
Pew notes that, because 2014 data is based on information gathered and averaged over a five-year period, the report may not reflect the most recent neighborhood changes nor capture neighborhoods that have only just begun to gentrify. (The report also doesn’t capture areas whose demographic changes have taken place over a period longer than 2000 to 2014.)
By the Pew definition, only 15 of Philadelphia’s 372 residential census tracts gentrified in that time period, all of them, with one exception, in or around Center City. Those were divided into four categories, based on their neighborhood composition in 2000: 1) areas with largely working-class African-American population, 2) mixed-income, mostly white neighborhoods, 3) old industrial areas with relatively few residents, and 4) non-affluent parts of Center City and surrounding neighborhoods.
The gentrifying neighborhoods weren’t Philadelphia’s poorest in 2000 — none of the 15 was in the bottom quarter of census tracts that year based on income. Twelve of the 15 had a higher share of white residents in 2000 than the city as a whole, and they just got whiter, with small increases in the number of Hispanic and Asian residents too. Overall the population of the affected neighborhoods grew by 15 percent, compared to 2 percent for the city as a whole.
The three census tracts that had been predominantly African-American, located in the Graduate Hospital neighborhood, saw the most dramatic population changes: The number of white residents tripled between 2000 and 2014, and the black population dropped from 7,793 to 3,450 — a 46 percent decline. They also saw the most striking changes in median income and median home price. High numbers of investor-owned and vacant properties in 2000 allowed for the construction of large numbers of new units, which fetch higher prices than existing ones. In these neighborhoods, the percentage of housing units built since 2000 was 16 percent, compared to 4 percent in the city overall. One of these tracts experienced the largest increase in median home sale price, from $25,000 in 2000-01 to $311,250 in 2013-14 — a jump of 1,120 percent.
Median income skyrocketed too. In one Graduate Hospital tract it increased by 111 percent (from $34,802 in 2000 to $73,472 in 2014), the largest increase among any of the gentrifying neighborhoods.
High rates of vacancy and investor-owned properties meant similar dynamics played out in the formerly industrial areas, which saw population growth of 57 percent and a significant housing buildup.
Growth was less explosive in the mixed-income white neighborhoods, where the population grew by 6 percent, 2 percent of housing units were built since 2000, and median home prices have remained below $300,000. Of this group of neighborhoods, Pennsport experience the largest increase in median household income, where it grew by 82 percent. According to Pew, these neighborhoods also experienced less dramatic changes in racial and ethnic makeup, having all been majority white in 2000 and remaining majority white in 2014.
The Center City and adjacent areas that gentrified also experienced comparatively less change in terms of population growth, racial and ethnic composition, and housing.
The report offers a neighborhood “affordability index” that compares residents’ inflation-adjusted incomes in 2000 to 2014 housing prices. A score over 3.0 indicates neighborhoods are no longer affordable to their existing residents. The Center City tracts scored 1.34; the mixed-income white tracts 1.09; the old industrial tracts 3.13; the working-class African-American tracts 6.36.
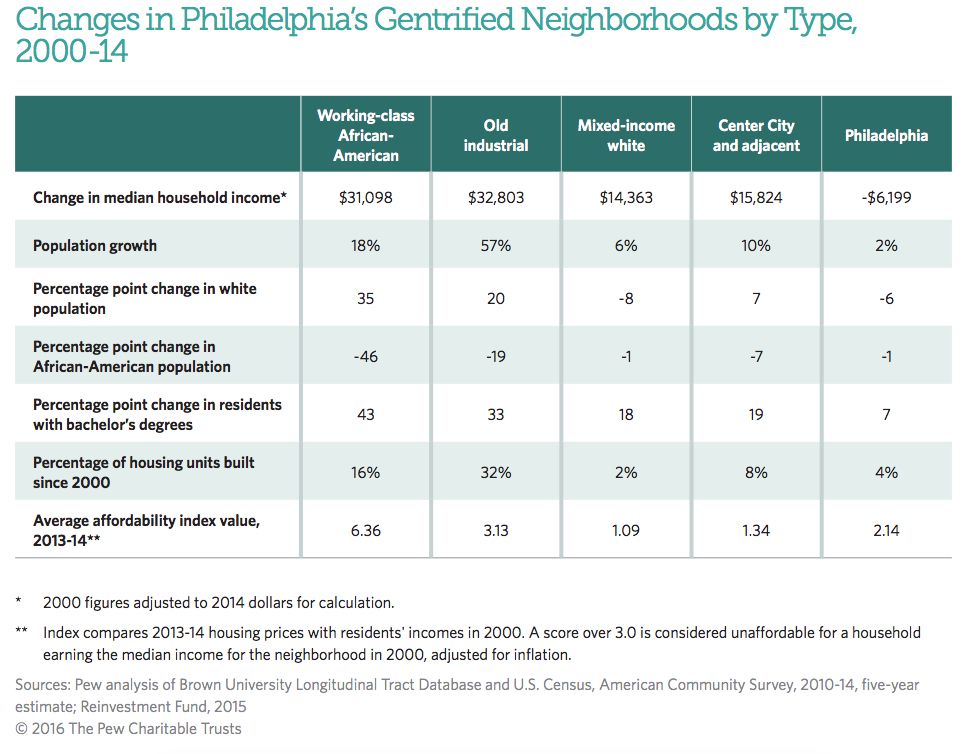
From Pew's “Philadelphia's Changing Neighborhoods” report
Then there are the 164 neighborhoods that experienced other forms of change that don’t count as “gentrification” by Pew’s definition. Eleven additional tracts (not including the three in Graduate Hospital) were majority black in 2000 but not in 2014. Eight of those were located near colleges and universities. The report notes that the universities themselves contributed to these changes, by encouraging more staff to settle in the neighborhood, or recruiting so successfully that dorms could not be offered to upperclassmen, who then sought housing off campus.
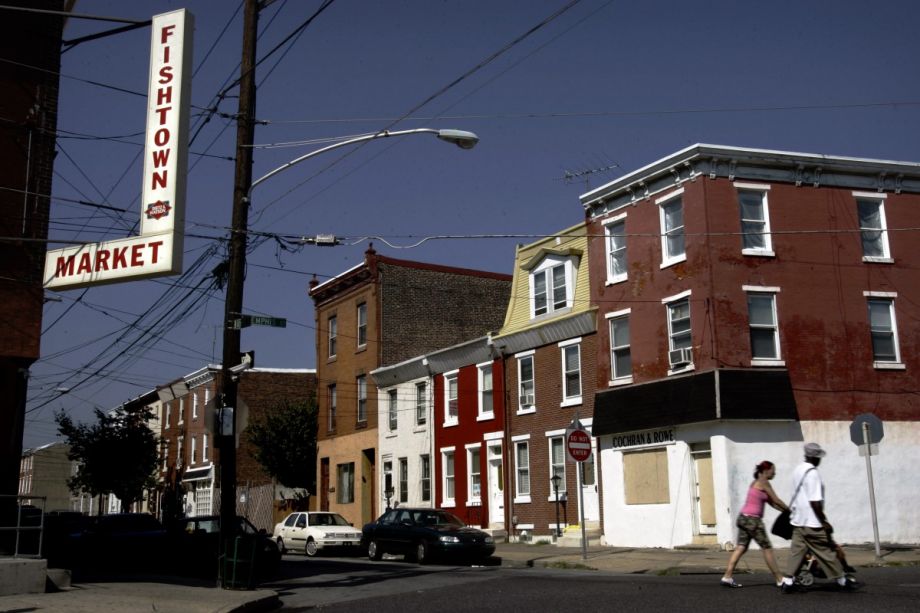
Fishtown, a northern neighborhood whose uptick in bars and restaurants suggests it would be an excellent candidate for the gentrification label, doesn’t qualify, according to Pew. The southern census tract of the neighborhood had a median income in 2000 too high for the study’s definition. The northern census tract did not show enough change in median income during the study period, and experienced little change in racial and ethnic makeup. Educational attainment did increase, as did the percentage of residents working in professional occupations — from 30 percent to 52 percent.
Neighborhoods where monolithic public housing complexes were replaced with low-density, mixed-income developments have also gone through massive changes over the past two decades, particularly where public housing sat beside high-income neighborhoods. The number of black residents fell in many of these neighborhoods, sometimes by as much as two-thirds, as the former complexes were cleared out and then demolished.
But the primary change revealed by the report was not gentrification but economic loss. The city’s median income fell from $43,659 to $37,460 between 2000 and 2014. Of the 164 tracts where median income fell significantly — 44 percent of the city’s neighborhoods — 120 already had median incomes below 80 percent of the regional median in 2000. Only 10 percent of the city’s census tracts saw incomes increase, including the 15 gentrifiers, seven low-income tracts that stayed low income, and 15 higher-income tracts.
“This gentrification stuff is happening in very few places, affecting a small number of people. We have many more poor neighborhoods where there is no change; we need policies that will also benefit those neighborhoods,” said Beth McConnell, policy director of the Philadelphia Association of Community Development Corporations, in the report.
Those policies would be intended to spur equitable development, according to Pew, with questions about how the government can and should intervene as neighborhood real estate values rise. The Philadelphia Land Bank could be used to transfer publicly owned parcels in changing neighborhoods for use by community development corporations or subsidized housing. The city’s inclusionary zoning incentives could also be beefed up to increase the number of affordable units being built by for-profit developers. Other ideas include focusing on retaining existing affordable housing by repairing what already exists, and instituting a flip tax on owners who sell properties less than two years after purchase, and using the revenue to fund affordable housing programs.
Next City’s coverage of Philadelphia’s changing neighborhoods is made possible with the support of the William Penn Foundation.
Jen Kinney is a freelance writer and documentary photographer. Her work has also appeared in Philadelphia Magazine, High Country News online, and the Anchorage Press. She is currently a student of radio production at the Salt Institute of Documentary Studies. See her work at jakinney.com.
Follow Jen .(JavaScript must be enabled to view this email address)