With newly released studies on everything from safety in numbers to childhood helmet use, pedestrians and cyclists hardly seem to suffer from a lack of data. But when the U.S. Department of Transportation released a Vision Zero-like Mayors’ Challenge on January 22nd, Secretary Anthony Foxx tasked city officials with creating better metrics — specifically, “count data, travel survey data and injury data.”
According to advocates and transportation officials, the DOT’s declaration about a “lack of systemic data” on government’s municipal ground floor isn’t a mistake. Yes, national reports detail the country’s most dangerous streets, but for local planners who want to boost and measure multi-modal travel, established metrics often fall short.
Take Eugene, Oregon. The small city is working on an incentive-heavy plan to cut transportation emissions.
One target involves doubling the share of trips by bike over 20 years — a lofty goal that can’t be accomplished without consistent, comprehensive measurements. But as Transportation Planning Manager Rob Inerfeld explains, gathering these numbers has taken some outside-the-box research.
“The ACS is limited,” he says, referring to the U.S. Census Bureau’s American Community Survey, which measures commuting patterns (among other things).
Echoing national advocates, he points out that the survey’s focus on getting to and from work is artificially narrow. According to Streetsblog, journeys to one’s place of employment make up only about 20 percent of all trips.
The survey also asks only about “primary” transport, which could leave out a lot of non-motorized movement.
“Today I’ve biked, walked and driven a car and it’s only 1:35,” Inerfeld says.
Adding that planners have realized the need for better numbers, he lists several strategies. Last year, the city commissioned a professional research organization to dig deeper and conduct a 500-person phone survey with quotas set by age, gender and geographic area. The survey, which will be replicated periodically to measure progress, assessed how often and why residents bike, and whether they’d prefer to cycle more often. The region’s Metropolitan Planning Organization has also set up numerous bike counters to measure progress.
Small cities like Eugene aren’t alone in their quest for better analytics. In Chicago, commuting only makes up about 15 percent off all trips according to Ron Burke of Active Transportation Alliance.
“That leaves 85 percent of all trips that we just don’t have data on,” he says.
Chicago’s regional MPO conducted a massive travel survey between 2007 and 2008, Burke adds, which has allowed the organization to make some estimates, including total daily ridership. But though he says it’s a good start, he’d like to see statistically significant info-gathering sessions completed more regularly — in Chicago and elsewhere.
“The short answer is that we need more regional household travel surveys,” he says.
According to Darren Flusche, of the League of American Bicyclists, limited, blurry numbers don’t just affect municipal officials — they also tie the data-gathering hands of national researchers and advocates.
“We need exposure rate to understand relative risk,” he says, explaining that while many cities gather injury and fatality data for certain corridors, those numbers aren’t always stacked against total walkers or bikers. Two intersections could both be the site of X fatalities per year, but if you don’t know how many people cross, you can’t know which is more dangerous.
And he echoes Inerfeld about the ACS.
“We don’t have an all-trip measurement,” he says, adding that even the national Dangerous by Design report is bound to commuting numbers.
A supporter of the Mayors’ Challenge data component, Flusche would like to see several standardized systems trickling up from city planners: regular all-trips surveys with large samples, expanded bike counts for a “broad, aggregate sense of how many people are walking and biking,” and various elements to determine the worst corridor and crossing.
“What is the safest city to walk and bike — what is the most dangerous city to walk and bike?” he asks. “We think we know, but really we need better numbers.”
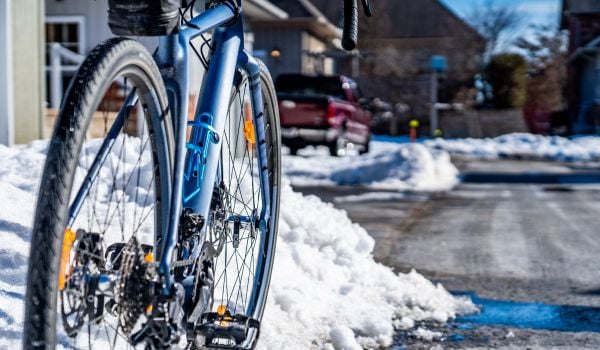
In Eugene, Inerfeld is positive about the city’s new tools and the trends they visualize. Surveys will help planners record changes over time, he says, while bike counters show broad upticks and downticks along with more nuanced information, like how biking changes seasonally. Comparing routes can also tell officials which streets are attractive for non-motorized transportation, and allow them to replicate those conditions.
For his department, the new methodologies were a simple matter of trying to meet citywide goals.
“We decided we needed better tools,” he says.
The Works is made possible with the support of the Surdna Foundation.

Rachel Dovey is an award-winning freelance writer and former USC Annenberg fellow living at the northern tip of California’s Bay Area. She writes about infrastructure, water and climate change and has been published by Bust, Wired, Paste, SF Weekly, the East Bay Express and the North Bay Bohemian
Follow Rachel .(JavaScript must be enabled to view this email address)