When Ben Wellington started teaching statistics to urban planners at Pratt Institute’s Graduate Center for Planning, he tried to make the class less boring and more consequential by “throwing away the textbook and building it around real data sets,” namely the heaps of government data that New York City has pushed into the world in recent years. In February, Wellington started publishing the maps and charts he and his class came up with on a blog called I Quant NY.
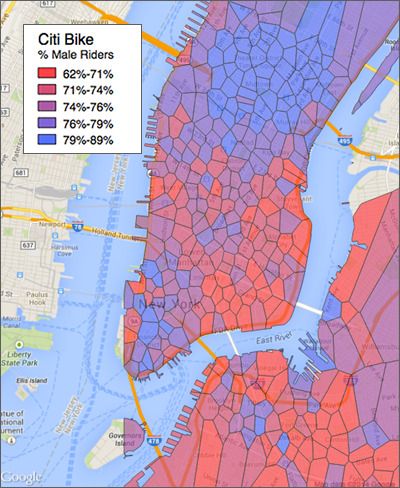
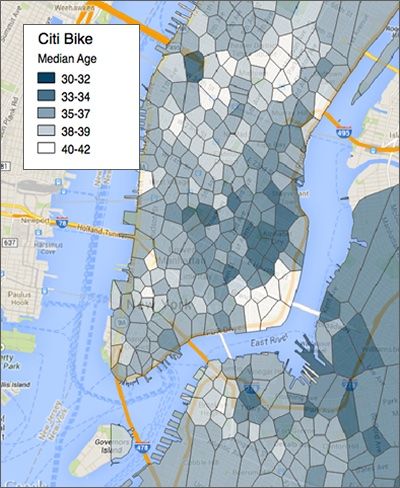
Last week came a new bounty: Nitty-gritty details on Citi Bike’s first eight months of operation, including not only station activity and how long trips are lasting, but also the age and gender of riders themselves. The neat and perhaps unexpected thing about this data is how it can tell secondary stories that have nothing to do with bikes or biking.
Take the question of where New Yorkers go out late on weekends. Wellington looked at the relative number of departures by riders with annual memberships from Citi Bike stations that happen between midnight and 4am (Citi Bike is open 24 hours a day). People are most likely to take out a bike at all hours of the night in places like Manhattan’s Lower East Side and Williamsburg, Brooklyn.
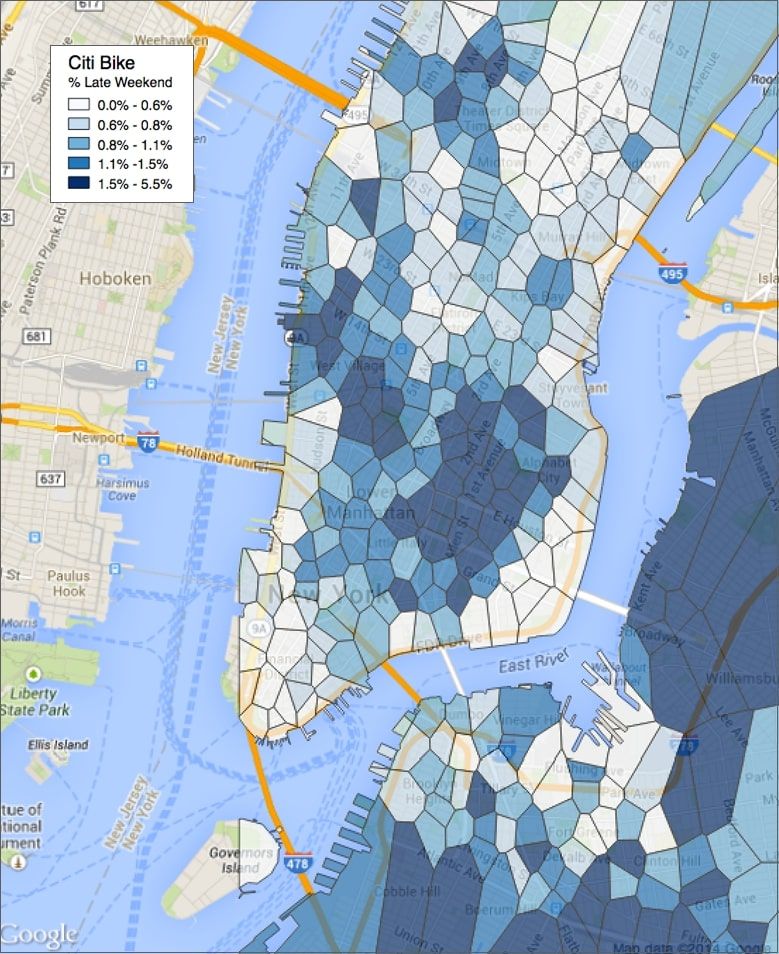
Wellington, who has a Ph.D. in computer science from New York University, explains how he makes his maps. Every Citi Bike station has a polygon drawn around it — a Voronoi partition, technically, wherein “seed” points anchor divisions in which every contained point is closer to its own seed than to any other. The maps are drawn in QGIS, the free and open-source mapping software, and he does his analysis with the “some nerdy language” — Python, it turns out — through a programming library called pandas. He admits that his maps aren’t as flashy as other data visualizations you see online, but all the better, he says, to let the stories they tell shine through.
Since the blossoming of open government data that began roughly a decade ago, there’s been a struggle to figure out what to do with all that information. Early on, the focus was on transparency for transparency’s sake, and a bit later attention turned to using it to boost civic participation. More recently there’s been new attention paid to the idea that free government data can spawn scores of new businesses. Wellington says his aims aren’t political, exactly, but inspired by the potential of smarter public policy informed by data.
“Data is driving policy more and more,” he says. “The city is releasing more and more data. But there’s a missing link between data and policy, and that’s analysis.” Besides, he adds, it’s neat to dive into the data and let it tell a city’s stories.
But that doesn’t mean policy changes will necessarily follow in short order. After his Pratt class chewed a different data set, on restaurant health inspection grades, Wellington posted on I Quant NY about a drop-off in point totals at the breaks from a C grade to a B grade and a B grade to an A grade, suggesting that the city workers doing the calculations were nudging restaurants into the higher categories. “Grade inflation,” Wellington says. “One way to say it is that inspectors are trying to be nice people. Or you can say the inspectors aren’t following the rules correctly and something’s amiss.”
Wellington’s post got picked up by the site Gothamist. When a city official released a response, though, it didn’t say much of anything at all: “Inspectors are not instructed to offer leniency, just to cite what they see. The final score is based on the extent of the violations that the inspector observes.”
But is it so crazy to think that this sort of attention may inspire health officials to give workers a few extra minutes of instruction on proper grading? Or even to dive into inspector-by-inspector numbers that the city presumably holds to figure out which graders are throwing in the extra points? “Maybe in a year from now I’ll have tested the data,” Wellington says of the score boost anomaly, “and it will have gone away.”

Nancy Scola is a Washington, DC-based journalist whose work tends to focus on the intersections of technology, politics, and public policy. Shortly after returning from Havana she started as a tech reporter at POLITICO.