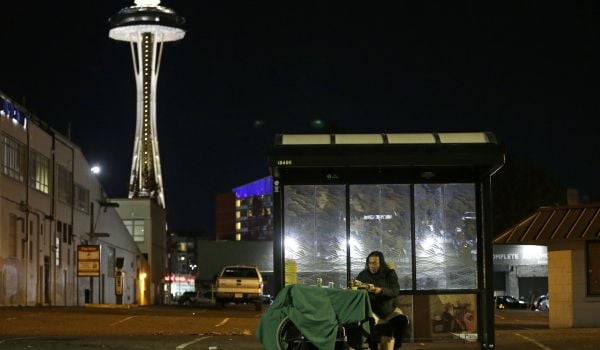
Over 15 million households across the U.S. are severely energy burdened – meaning that they spend more than 10% of their yearly income on energy bills. The problem is growing as prices rise and supply chains reel from the global COVID-19 pandemic. And winter is coming.
Energy burden is not distributed evenly between or within cities. The combination of high energy costs and low incomes make heat and electricity unaffordable for too many. And energy burdens have a snowball effect on many other health and economic outcomes, such as eviction rates, asthma, income stress, and mental health, so it is critical that cities mitigate the risk. Many cities have been very successful in doing so, while others still need a bit of a push.
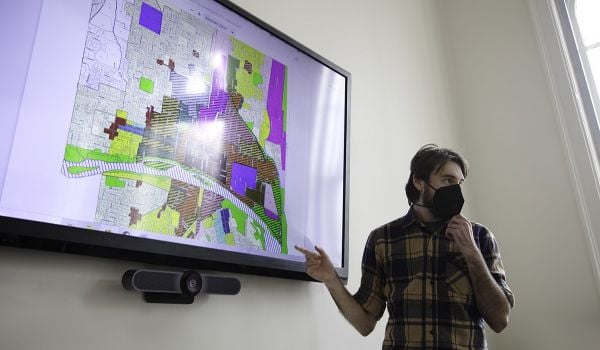
So, how is your city doing? To answer that question, Greenlink Analytics, a nonprofit working at the forefront of clean energy and climate equity, is tracking energy burden improvements. Using data from the Greenlink Equity Map, a tool that identifies and visualizes equity indicators and burdens at a community level, my coauthors and I explored changes in energy burdens over time. Our findings appear in a new report, which evaluates changes between 2013 and 2018 for 50 of the most populated metropolitan statistical areas (MSAs) across the U.S.
Where does your city rank?

As the chart above shows, energy burden has improved significantly for many cities, but others – not so much. Because energy burden is impacted by both household income and utility costs, it’s important to understand that there can be many explanations for a city experiencing an increase or decrease in energy burden.
The Detroit, Milwaukee, and Buffalo metro areas have experienced the greatest decreases in energy burden over this five-year time period. Matthew Donath, Environmental Sustainability Program Coordinator for the City of Milwaukee, believes his city’s improvements can be attributed to many factors, including energy efficiency programs that were launched with stimulus funding in 2012. The programs enable middle- and low-income families to finance efficiency upgrades through a local credit union, and to work with contractors to perform updates on homes. The more efficient a home is, the less the residents spend on energy.
The City of Buffalo has also made strides to lower its energy burden. The City is a part of the Five Cities Energy Plan, an initiative supported by the New York Power Authority to address energy efficiency in buildings, transportation, and other key areas. And in 2019, Buffalo announced a goal to “catalyze 100 megawatts of new clean energy,” which would reduce reliance on costly fossil fuels. To accomplish this, the local government is collaborating with the State University of New York at Buffalo and other institutions to fund projects that will oversee new solar energy installations. In the City of Detroit, where energy burden improved the most, the city’s energy company, DTE, was required to adhere to additional energy efficiency requirements set by the Michigan Public Service Commission. Cheaper (and more sustainable) energy means lower bills.
While city-run programs can have a substantial impact on energy burdens, other factors may be beyond local control. For example, projections show that an expected rise in retail energy prices and a cold winter has the potential to increase energy bills for households across the entire country. This could put thousands of households at risk for being severely energy burdened; some may even face eviction given the recent lifting of the nationwide eviction moratorium. Positive changes may also occur without direct government intervention. For example, in fast-growing Milwaukee, a boom in new construction and an influx of younger families moving into the city and updating older homes has led to an overall decrease in energy burden. Home updates can make the home more efficient, contributing to decreases in energy burden for the household and the city overall. However, it is important to note that there are still neighborhoods across the city who still don’t see these benefits reflected in their energy costs.
On the other hand, Sacramento, San Diego, and Virginia Beach are among cities that have seen the least improvement. This doesn’t mean that these cities have the highest energy burden, but rather that they have experienced the least improvement over time. In the case of the California cities, this could be attributed to the state’s longstanding energy efficiency programs that serve low- and middle-income households. Sacramento and San Diego have a lower percentage of energy-burdened households than most similarly sized cities outside of California.
Burdens vary by neighborhood
The report also shows stark differences in energy burden within cities – even between households that are just a few miles apart. Many neighborhoods with majority Black and/or Latino families experience high – and rising — energy burdens. In Milwaukee, for example, energy burdens increased in predominantly Black neighborhoods between 2013 and 2018.
Factors such as the age and condition of the home can affect how much households pay for energy, as it can cost more to heat or cool an older home that is less efficient. That is why many low-income households have seen their energy bills increase, even as costs are decreasing for their higher-income neighbors with more-efficient homes. On the other side of the equation, medical conditions and job layoffs can impact a household’s gross income, making energy bills more burdensome. These factors also have disproportionate impact on low-income families with less savings to cushion such blows.
Energy efficiency and weatherization are some of the most widely deployed solutions to address inequities in energy burden, but many programs are not tailored to serve highly burdened communities. For example, some programs are not available to renters, or lack financing options that make them accessible for low-income families. These flaws in program offerings and design are one reason that burdens remain stubbornly high in certain neighborhoods.
To develop impactful energy burden programs and initiatives, cities have to do their homework. They have to look at the data and understand the root causes to the differences they’re seeing in energy burden and also be able to identify the areas where energy burden is most severe. In order to lower energy burden across our cities, city governments will need to co-create equitable processes with community-based organizations who have experience working with communities who are severely burdened. Cities should defer to communities to better understand their needs and concerns. Cities should also work in parallel across their departments as energy burden can result in inequities in housing, health outcomes, and income.
Diamond Spratling is the GEM Project Manager at Greenlink Analytics where she leads the Greenlink Equity Map (GEM) in supporting the advancement of energy equity among cities across the U.S. Diamond is an impact-driven, environmental health professional who specializes in implementation, monitoring and evaluation, and spatial analysis.