


If you’ve ever wondered what your bank is invested in, there’s good news for you. Yes, good news, even now with everyone worried about the safety and soundness of their bank — because as it happens, your bank or credit union’s balance sheet is public information, updated quarterly.
Those balance sheets can give you broad information on how much in loans, treasury bonds and other bonds, stocks, real estate and other assets are in every bank’s or credit union’s portfolio, including aggregated information on the type of loans currently on a bank’s books. They also show how much of the bank’s deposits are actually covered by federal deposit insurance versus uninsured deposits.
A bank’s balance sheet can’t tell you what the current or ongoing risks are for each type of asset on its balance sheet, but there’s plenty of information sources that can help you assess that.
Here’s how to find and download all those balance sheets, some basics about risk levels and resources to understand more about the risk of some assets versus others. We’ll start with banks, then come back to credit unions.
Finding your bank’s balance sheet
Search for a bank’s financial reports by institution name in the FDIC’s BankFind database. Sometimes a bank’s actual name is different from what it goes by — M&T Bank for example is actually “Manufacturers and Traders Trust Company.” You can also search by a bank’s website, which might be more reliable for those who are now accustomed to online banking. Let’s just stick with M&T Bank for now. Click on the bank’s name in the search results. On the page that comes up, you’ll see a dropdown menu toward the bottom. In that menu, select “Assets, Liabilities, and Capital.” Then hit the “Generate Report” button below.
Doing so brings up the top levels of the balance sheet — specifically items 3 and 4, Total Assets and Total Liabilities. You’ll see the dollar amounts on the right — as the interface notes, all dollar amounts are displayed in thousands, so add three zeros to all the dollar amounts you see.
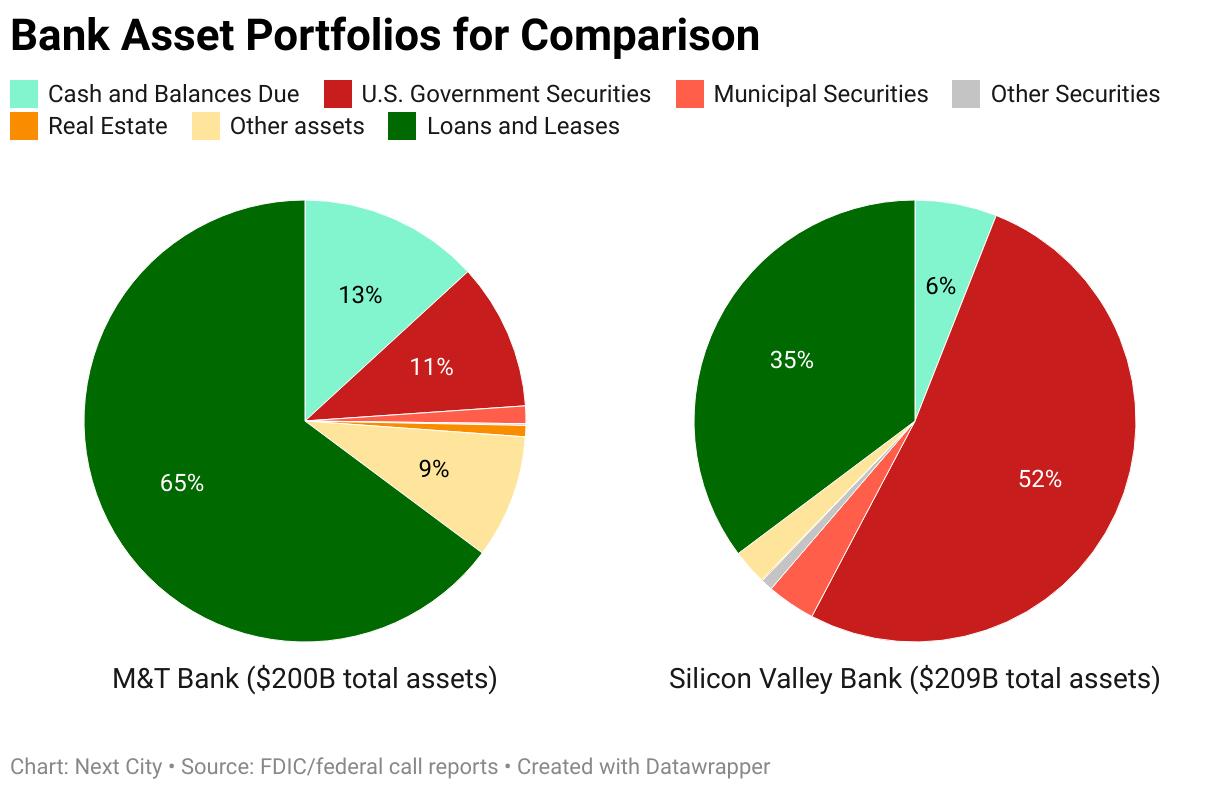
So M&T Bank has a $200 billion balance sheet. With every bank or credit union balance sheet, assets must always equal liabilities.
Checking your bank’s assets
Now let’s look at M&T Bank’s assets. Click on “Total Assets” — turns out, it’s a dropdown tree with multiple levels. The first level that comes up includes the basic big buckets:
-
Cash and balances due: That’s cash on deposit at other banks, including at the Federal Reserve, which serves as the main bank for banks. If you click on that item it’ll show you the breakdown between cash at other private banks and cash at the Federal Reserve.
-
Securities: That’s stocks and bonds. Click on that and the breakdown appears between various categories of securities, including U.S. Government Securities. These are what’s in the news because of Silicon Valley Bank’s collapse. According to the most recent available data, Silicon Valley Bank had $108 billion in U.S. Government Securities on its balance sheet. You can see here that although M&T’s overall balance sheet is about the same size as the former Silicon Valley Bank, M&T has only $21 billion invested in U.S. Government Securities — along with $243 million in corporate bonds and $141 million in “equities,” which is the financial term for publicly-traded stocks.
-
Net loans and leases: As you might expect, this is the biggest bucket for most banks, and that’s the case here, with M&T Bank having $129 billion in loans on its balance sheet, or 64% of its assets. By contrast, Silicon Valley Bank had only $73 billion in loans on its balance sheet, just 35% of its assets. There are multiple reasons for the difference, but a lot has to do with a bank’s business model — how much demand is there for loans from the clients the bank attracts? How much in loans does the bank actually want to make? Click on “net loans and leases” and you’ll reveal some basic categories of loans, some of which overlap — real estate loans, loans to individuals that include some real estate loans, breakdowns of commercial real estate loans and real estate loan types. There’s a line for “Small Business Loans”; click on that to see a breakdown of those loans, some secured by real estate as collateral and some not secured by real estate collateral. The Mighty website combines this data with other public data to generate a profile of each bank or credit union with an even deeper analysis of each bank’s impact on its communities.
Checking your bank’s liabilities
There’s a lot to see and think about on the assets side. But before digging deeper, let’s look at the liabilities side of the bank balance sheet — that’s where you’ll find aggregated information on the bank’s deposit base. Clicking on “Total Liabilities and Capital” reveals the bank’s capital stack.
“Total equity capital” consists of shareholder dollars and accumulated profits held by the bank as its capital base. Roughly speaking, bank regulations require banks to have around $1 in equity capital for every $12 in total assets, or a minimum ratio around 8%. Most banks like to stay well above that as a cushion. M&T Bank’s $24 billion for $200 billion in assets is a ratio of 12%. Equity capital gets depleted when banks take losses, and when it gets to be too low, banks have to raise more capital from shareholders. Silicon Valley Bank tried to do this, and when potential investors said no, it helped precipitate the collapse of the bank.
“Total liabilities” consists almost entirely of deposits. Clicking on that reveals some important breakdowns. Clicking on “Deposits held in Domestic Offices” reveals an estimate of the bank’s federally insured deposits — 52.94% in M&T Bank’s case, which is roughly typical. The FDIC’s deposit insurance fund covers up to $250,000 in deposits per depositor, which covers most individuals and some small businesses, but many businesses including small businesses and also government entities end up holding more than $250,000 in their bank accounts just as part of their day-to-day, month-to-month cash flow.
There are tools like Insured Cash Sweep and CDARS that allow depositors to automatically split up their cash across multiple banks to keep their accounts below the $250,000 threshold, but for a variety of reasons not everybody uses those tools. At Silicon Valley Bank, just 5.69% of deposits it held were covered by FDIC insurance, which is remarkably low, in part because the bank required some clients to do all of their banking at Silicon Valley Bank.
The “Deposits held in Domestic Offices” breakdown also shows checking accounts (transaction accounts) versus savings accounts and certificates of deposit or other limited access accounts (non-transaction accounts). Clicking on either of those reveals aggregated breakdowns of who holds those deposits at any given bank — individuals and private businesses, government entities, foreign entities.
Next scroll down if necessary and click on the “Domestic Deposits and Maturity Based on the FDIC Insurance Threshold” line to reveal additional information including how many accounts at the bank are under the FDIC deposit insurance threshold, how many accounts are above the threshold, and how much in deposits each of those buckets hold. Other breakdowns show how much in certificates of deposit the bank currently holds — listed as “time deposits.”
The topline deposit numbers reveal an important reason behind Silicon Valley Bank’s demise: the shrinking of its deposit base, which eventually forced the bank to shrink its balance sheet. In just one year, from the end of 2021 to the end of 2022, it went from $191 billion in deposits down to $175 billion. Most analysts attribute that to venture capital investment drying up, so the startups and venture capital funds that had accounts at Silicon Valley Bank stopped bringing in new cash to replace the cash they are constantly burning on salaries and operations. In contrast, over the same time frame M&T Bank went from $133 billion in deposits at the end of 2021 to $165 billion at the end of 2022.
Finding your credit union’s balance sheet
For credit unions, go to the National Credit Union Administration’s Research a Credit Union Tool and you can search for your credit union by name. In the search results that appear, next to the credit union you want to see click on “view.” In the profile page that comes up there’s some basic, useful information. For the full picture, find the dropdown menu under “Call Report” on the right hand side of the page. Pick the most recent date, and then click “download” below.
You’ll get a PDF file that contains all the information above, same as banks — remember to look for the pages that say “assets” or “liabilities” at the top. Scroll a few pages past that and you can see credit union call reports also show the exact number of active loans broken out by category, as well as the average interest rate for each loan category.
Understanding your bank’s level of risk
Every bank or credit union is supposed to take risks with the assets they hold in their portfolio — the challenge is deciding which risks to take and how much of any risk may exist at any moment in time. The banking industry recognizes different categories of risk, including credit risk, interest rate risk, liquidity risk, compliance risk, even reputation risk. As one of the three main federal banking regulators, the Office of the Comptroller of the Currency has a handy overview of the different kinds of risks.
Credit risk is the one most familiar to those who aren’t professional bankers. In brief, credit risk is the risk of the underlying borrower eventually repaying the initial loan or investment.
From a credit risk perspective, U.S. Government Securities are one of the safest investments to hold, almost as safe as cash, because like cash they’re backed by the full faith and credit of the U.S. Federal Government. That’s just as true now as it was before the Silicon Valley Bank collapse, and it’s why every bank has at least some of its portfolio invested in U.S. Government Securities. As long as the Federal Government exists and has the authorization to pay its bills, U.S. Government Securities will pay interest and won’t default (in theory, but the debt ceiling is a politically-imposed constraint we won’t get into right now).
Corporate bonds are generally considered next safest, assuming they’re rated “investment grade” by a reputable rating agency like S&P, Moody’s, Fitch or KBRA. That’s because if a corporation goes bankrupt, bondholders have the right to be repaid first in a firesale of the corporation’s real estate, machinery and other assets. Corporate equities or stocks are riskier, because corporate shareholders are second in line after bondholders in the case of a corporate bankruptcy firesale. Most shareholders expect if a company goes belly up, they won’t get back their investment.
Loans vary in terms of perceived risk, based on underlying collateral and other factors. Unsecured loans made without collateral are riskier than secured loans, secured by property, cash or other assets. But all loans are generally considered riskier than U.S. Government Securities or blue chip corporate stocks or bonds, since they’re not backed by one of the world’s most powerful governments or wealthiest corporations.
Silicon Valley Bank’s demise has to do with interest rate risk. While U.S. Government Securities are very safe from a credit perspective, they carry more risk from an interest rate perspective because they are generally fixed-rate investments — meaning the interest rate is set from the moment of the initial sale of the security. Most of Silicon Valley Bank’s U.S. Government Securities were acquired during a period when interest rates were very low. But it needed to sell $21 billion of those securities when interest rates had risen significantly, which meant it needed to sell them for less than what the bank originally invested or paid to acquire those investments. That sale for a loss spooked the bank’s depositors and sparked a bank run.
But as I explain in my previous story about the collapse of Silicon Valley Bank, the reasons why that bank had to sell those U.S. Government Securities for a loss and the consequences of that sale are very specific to that bank and a handful of others. Nearly all other banks have a very different set of circumstances. Take M&T Bank, which is about the same size as the former Silicon Valley Bank was, but has far less in U.S. Government Securities on its balance sheet and a deposit base that hasn’t been bleeding cash. Silicon Valley Bank was a very unusual bank that specialized in a very particular niche, which came back to bite them in the end.
Most banks and credit unions have a balance sheet that looks more like M&T Bank, even if they are much smaller in overall size. Many community banks and credit unions have 70%, 80% or even 90% of their portfolios in loans.
But you don’t have to take my word for it. Go and check out your bank or credit union for yourself.
This article was updated on July 13, 2023 to reflect improvements to the FDIC website that make it a bit easier to find banks’ financial reports.
This article is part of The Bottom Line, a series exploring scalable solutions for problems related to affordability, inclusive economic growth and access to capital. Click here to subscribe to our Bottom Line newsletter.

Oscar is Next City's senior economic justice correspondent. He previously served as Next City’s editor from 2018-2019, and was a Next City Equitable Cities Fellow from 2015-2016. Since 2011, Oscar has covered community development finance, community banking, impact investing, economic development, housing and more for media outlets such as Shelterforce, B Magazine, Impact Alpha and Fast Company.
Follow Oscar .(JavaScript must be enabled to view this email address)