Gentrification in the Bay Area shows no signs of slowing. In fact, it’s accelerating.
As housing prices rise and tech jobs continue to flood the region, more people in San Francisco and neighboring cities are at risk of displacement than are already experiencing it, according to UC Berkeley researchers. “The crisis is not yet half over,” says one of those researchers, Karen Chapple, who is a city and regional planning professor.
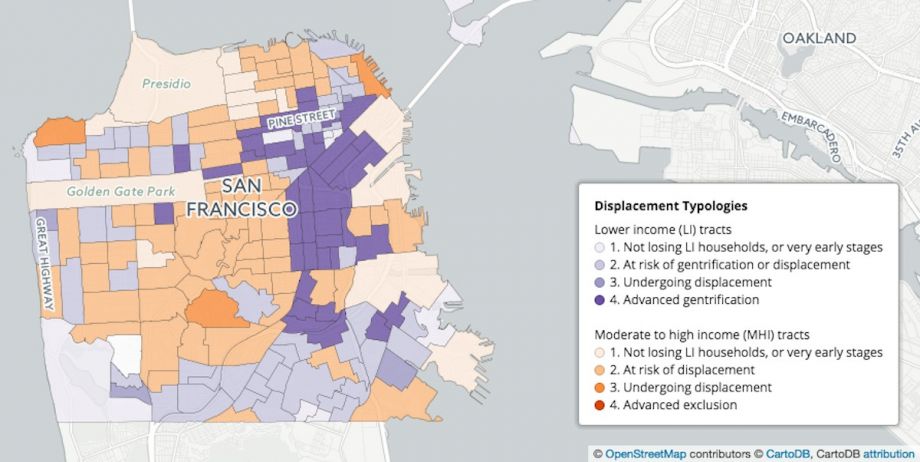
Chapple and fellow researcher Miriam Zuk’s Urban Displacement Project maps, released this week, are the result of nearly two years of regional demographic data analysis and in-depth case studies of nine Bay Area communities. The interactive map uses data from the U.S. Census, American Community Survey and others to visualize changes over time, revealing factors like employment density, percentage of renter households, non-white population and change in college-educated adult population.
Users can drill down by Bay Area county and city and also choose data options such as change in “percentage of low-income households” and “market-rate units as percentage of new building.”
The researchers found that neighborhoods that have easy access to rail transit, pre-1950s housing stock and rising housing prices are especially at risk of losing low-income households. And it’s not just low-income communities that are at risk: Higher-income areas with low-income households in the mix are rapidly losing that population.
Census tracts undergoing or at risk of displacement lost approximately 25,000 low-income households between 1990 and 2013 — more than half of the neighborhoods lost low-income black households, far more than any other demographic.
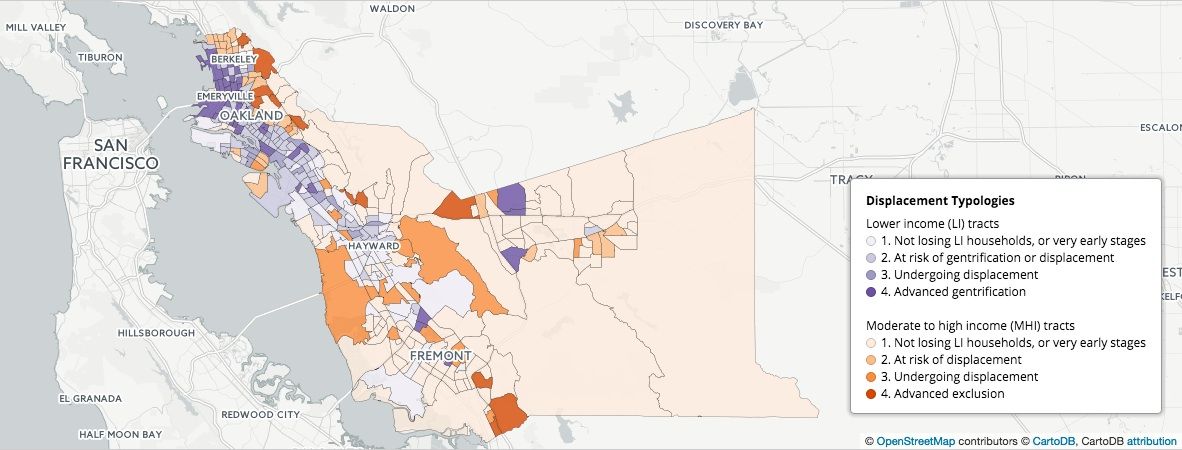
Alameda County (Credit: UC Berkeley Urban Displacement Project Maps)
Researchers developed four stages of gentrification and displacement to evaluate neighborhood risk. The spectrum runs from “not losing low-income households or very early stages” to “advanced gentrification” in low-income neighborhoods and “advanced exclusion” in moderate-to-high-income neighborhoods.
Using this spectrum, the Urban Displacement Project map can serve as a regional early warning system, allowing community stakeholders to assess where they fall and implement policies that foster equitable neighborhoods.
They might take a cue from East Palo Alto and Marin City, two communities where Chapple and Zuk expected to see advanced gentrification, but didn’t.
“Places that have strong tenant policies — rent control, just eviction policies — are doing a good job at keeping people in place,” says Zuk, citing East Palo Alto. “People thought Marin City would gentrify a long time ago and it hasn’t because it has a good affordable housing stock.”
For other Bay Area cities, this study may just come too early to tell. The most recent data is from 2013.
Jen Kinney is a freelance writer and documentary photographer. Her work has also appeared in Philadelphia Magazine, High Country News online, and the Anchorage Press. She is currently a student of radio production at the Salt Institute of Documentary Studies. See her work at jakinney.com.
Follow Jen .(JavaScript must be enabled to view this email address)