Most of the urban U.S. population living in economic distress is concentrated in just 80 cities — and the majority of those are in the Northeast and Midwest. Many who live in the Rust Belt were struggling before the recession hit, suffered deeply because of it, and they’re still struggling now — from population, job and business loss — even as the country’s more prosperous cities benefit from an overall upward trend in urban migration.
According to a new analysis by the Economic Innovation Group, an advocacy organization promoting entrepreneurship and private investment as vehicles for improving the American economy, those 80 cities account for only 40 percent of the total U.S. urban population, but two-thirds of the urban population lacking in economic opportunity.
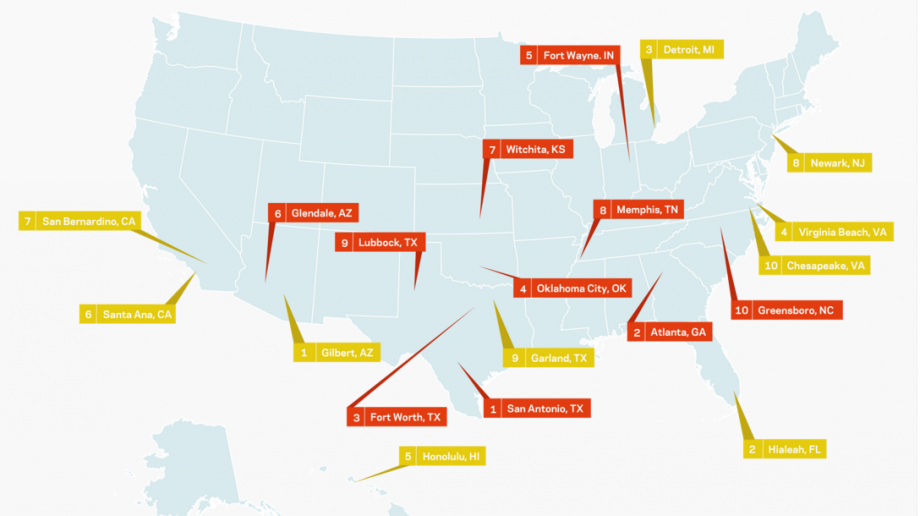
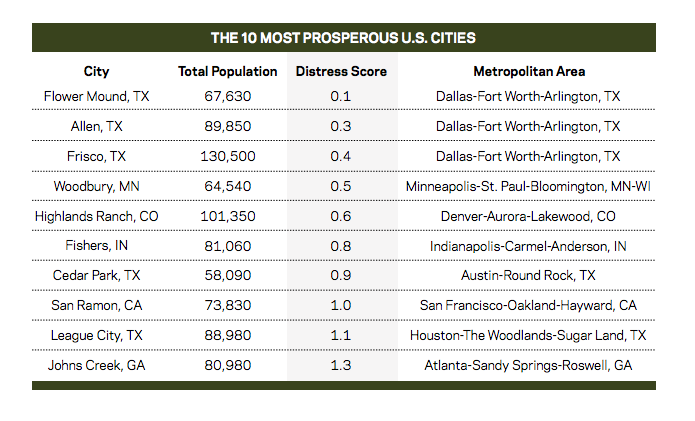
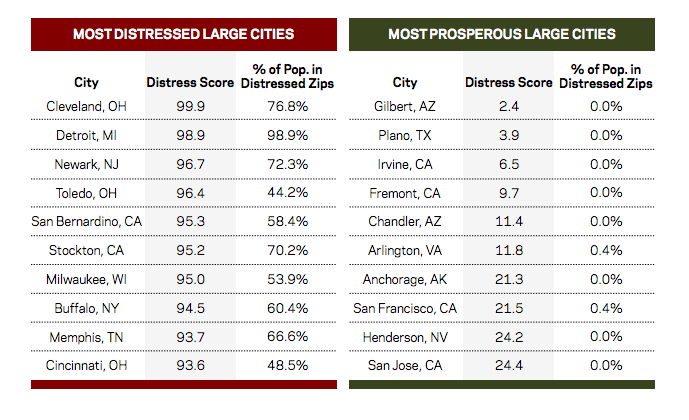
By contrast, the country’s most prosperous cities — mostly concentrated around new tech centers and burgeoning metro regions in California and Texas — are relatively new, were left mostly unscathed by the Great Recession and are experiencing healthy population growth.
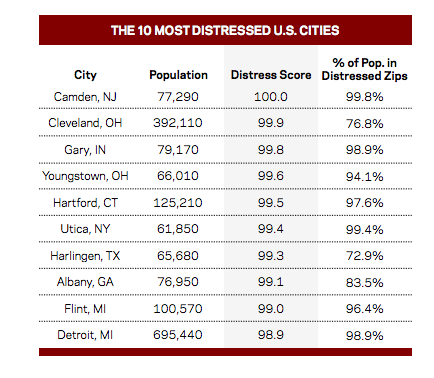
The Economic Innovation Group’s “Distressed Communities Index” (DCI), published last week, evaluates economic prosperity in the U.S. by looking at seven metrics in more than 25,000 U.S. ZIP codes, including poverty rate, percentage of adults without high school degrees, percentage of adults not working, and change in number of business establishments between 2010 and 2013. Each ZIP code, city and state is assigned a “distress score.”
In Camden, New Jersey, for example, the most distressed city in the country, 32 percent of the population has no high school degree. The city’s median income is just 36.4 percent of the state’s. Camden’s distress score is 100, with 99.8 percent of its residents living in a distressed ZIP code.
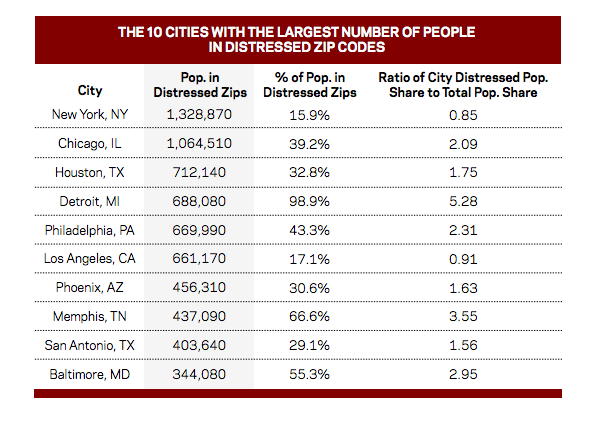
On a whole, notes the report, a city’s prosperity does not necessarily predict the share of its population living in distress. New York, for example, is considered a top-performing economy with moderate levels of citywide distress, despite 1.3 million New Yorkers living in distressed ZIP codes — about 15.9 percent of the population. Houston, on the other hand, is one of the fastest-growing cities in the country, but 32.8 percent of its population still lives in economic distress.
The study also finds that America’s most and least prosperous ZIP codes are pulling farther apart. While the wealthiest 10 percent of ZIP codes saw employment rise by 22 percent and new business establishments rise by 11 percent between 2010 and 2013, the bottom 10 percent of ZIP codes remained trapped in a deep and enduring recession. During the same time period, those ZIP codes lost 13 percent of their jobs and saw 1 in 10 businesses close.
Spatial inequality trends highest in Southern cities, but very few highly prosperous cities experience broadly shared prosperity. Just 9 of the 100 largest cities experience high prosperity combined with low spatial inequality.
Interestingly, cities at the center of the knowledge and technology economy — including San Francisco — are among the most prosperous U.S. cities with some of the highest rates of income inequality, but experience relatively low spatial inequality. The report suggests this is because income inequality is a function of the types of jobs created by the local economy, whereas inequality of opportunity stems from a broader variety of factors.
“Millions of Americans continue to feel left behind by the economic recovery. The DCI helps us understand what is driving these sentiments and why, and how, place matters,” said Steve Glickman, co-founder and executive director of EIG in a statement. “Achieving the American dream should not be predetermined by the ZIP code where you happen to be born.”
Interactive maps of the study’s findings are available here.
Jen Kinney is a freelance writer and documentary photographer. Her work has also appeared in Philadelphia Magazine, High Country News online, and the Anchorage Press. She is currently a student of radio production at the Salt Institute of Documentary Studies. See her work at jakinney.com.
Follow Jen .(JavaScript must be enabled to view this email address)