The National Equity Atlas, launched almost two years ago, features racial breakdowns of numerous economic and related data, such as median hourly wages, unemployment and educational attainment, so policymakers, researchers and anyone can see clearly who is benefiting from the economy and who is being left behind. Sarah Treuhaft, director of equitable growth initiatives at PolicyLink, which created the atlas with the USC Program for Environmental and Regional Equity, remembers presenting it for the first time at a conference.
“We were so excited to present the atlas, and then the first comment was from a South Asian activist asking why we hadn’t broken down the Asian population into subgroups,” says Treuhaft. It was a slight letdown at an otherwise celebratory moment, but not something to dismiss. “I’ll never forget that,” she adds.
After more than a year crunching the numbers, PolicyLink and the USC Program for Environmental and Regional Equity have finally done it. Today, they are unveiling detailed racial subgroup data, including ancestry and nativity data, providing a clearer picture of equity and opportunity across the United States.
The atlas now offers detailed racial subgroup data for Asian, black, Latino, Native American and white racial subgroups for six economic indicators: median wage, unemployment, the percentage of workers making $15 an hour, disconnected youth, homeownership and educational attainment.
It was always in the works, Treuhaft says, “but it was a lot of work to figure out the right methodology to get the data together.”
The challenge is in the number of observations per subgroup as geographic scope gets smaller. “The level of detailed subgroups varies based on the size of the geography you’re looking at,” Treuhaft says.
The atlas currently breaks down data geographically for the 150 largest regions, the 100 largest cities, and all 50 states. To include data for a given indicator, the atlas has a standard of at least 100 observations per racial subgroup. The smaller a city or region, the fewer subgroups, as subgroups with fewer than 100 observations get combined into various “other” categories.

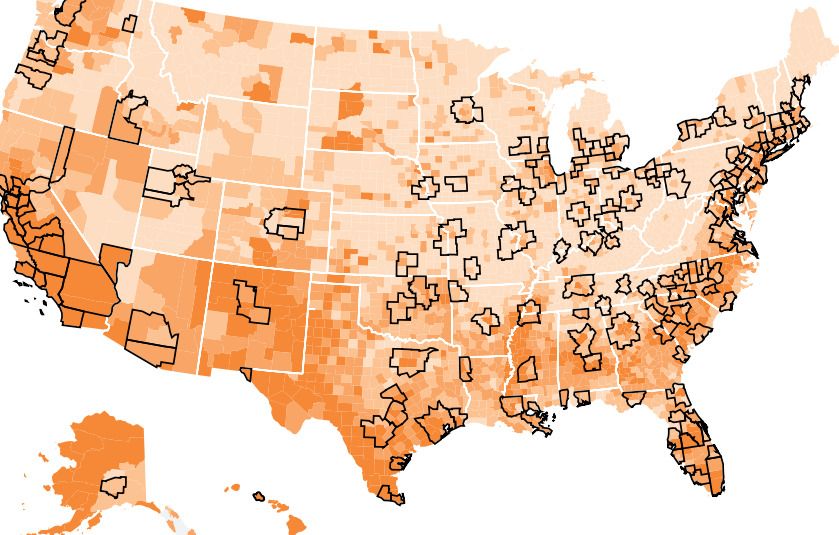
U.S. median hourly wage by Asian/Pacific Islander subgroups, from the National Equity Atlas
For example, under median hourly wage, the atlas has 28 Asian subgroups at the national level, but only 15 Asian subgroups at the San Francisco-Oakland-Fremont Metro Area level.
“While we can’t provide the same national picture for every city or every region, what we can see with this data is that there is a ton of variation within these broad racial or ethnic categories,” Treuhaft says.
The variation is particularly a challenge for the Asian and Pacific Islander subgroups because of the “model minority” myth being so prevalent.
“On educational attainment or disconnected youth, they’re doing better as a group than others, but it’s really masking a lot,” Treuhaft says. There’s significant variation in other groups, she adds, but it’s not being masked as well.
“It’s detrimental to the groups who aren’t doing as well. It really hinders the development of the types of targeted strategies you need to reach those groups,” Treuhaft points out.
The National Equity Atlas team will be hosting a live webinar demonstrating the newly released data on May 26 at 3 p.m. Eastern. (Register here.)
The Equity Factor is made possible with the support of the Surdna Foundation.

Oscar is Next City's senior economic justice correspondent. He previously served as Next City’s editor from 2018-2019, and was a Next City Equitable Cities Fellow from 2015-2016. Since 2011, Oscar has covered community development finance, community banking, impact investing, economic development, housing and more for media outlets such as Shelterforce, B Magazine, Impact Alpha and Fast Company.
Follow Oscar .(JavaScript must be enabled to view this email address)