The number of transportation options has exploded in recent years, with bike-share, peer-to-peer carpooling apps, car-share services like car2go, and ride-sourcing services like Uber and Lyft redefining urban transit and sharpening questions about equity and access that have always plagued traditional modes. As cities scramble to regulate these new services and to ensure they don’t create a tiered system of transit access, the nonprofit Shared Use Mobility Center (SUMC) has created a handy toolkit in four parts.
One mapping tool shows the location of all shared-use vehicles and the service areas of other shared-use providers in more than 50 North American cities. The same tool also maps transportation access and identifies areas ripe for shared-used service expansion in the 27 cities in the Urban Sustainability Directors Network, which partnered on the tool. Another database compiles over 600 policies, studies and plans related to shared mobility, as a guide to best practices in regulation. And lastly, a benefits calculator estimates the number of additional services cities would need to implement in order to reduce personal vehicle ownership, and calculates the related carbon emissions.
An accompanying report explains each tool, and examines trends in non-traditional transit, broken down by city size and neighborhood demographics. Analyzing the number of shared-use options in the 27 USDN cities, the report finds that while the largest cities (over 1 million residents) have the most car-share vehicles and bike-share bikes on average, mid-sized cities (between 200,000 and 1 million residents) have the highest proportion of vehicles to residents, followed by the smallest cities. On average, for example, the largest cities have 2,128 bikes in their bike-share systems, compared to 608 in mid-sized cities. That breaks down to 6 bikes per resident in the biggest cities, and 12 per resident in the medium sized ones. Small cities (less than 200,000 residents) have 122 shared bicycles on average, 10.6 per 10,000 residents. The same pattern holds true for car-share vehicles, with one-way car-sharing (like car2go, which isn’t as widespread as services like ZipCar) as the only exception.
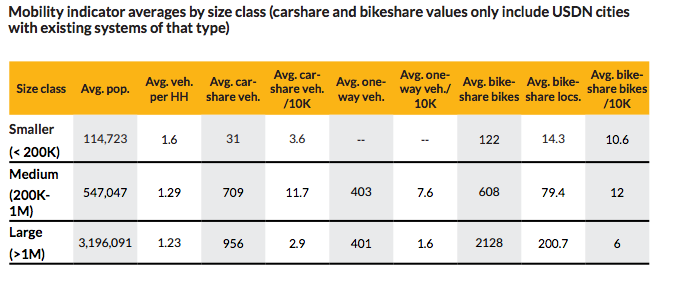
The report notes that the discrepancy may reflect the relative ease of scaling up a system in smaller communities with less density, where there is less demand for curb space and parking. It also points out a clear relationship between the levels of transit use in a city and the availability of shared mobility services. “Cities with more rail lines and bus routes tend to have more car-share cars and bike-share bikes,” states the report, suggesting that in places where household car ownership is already low because of dense transit systems, residents eagerly adopt new modes.
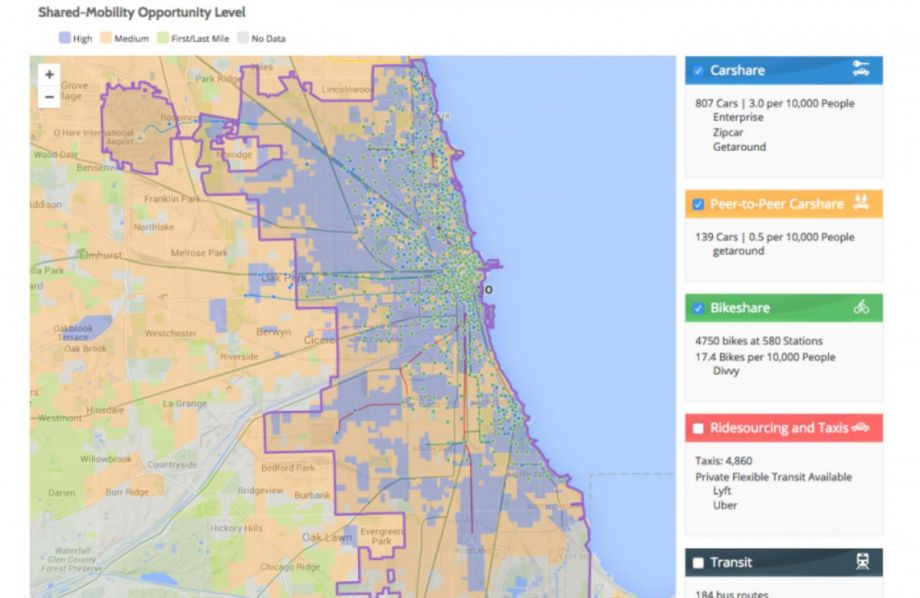
Users can compare the availability of different modes in 50 cities using the Shared Mobility Mapping Tool, which also identifies places that are underserved by shared use options. Areas with the highest potential for shared mobility expansion appear in blue; places with medium potential in orange; and neighborhoods that could primarily support new modes for first mile/last mile connections to transit in green. Users can also turn on overlays that show neighborhoods’ median income and — in a somewhat confusing phrasing — the percentage of the population that is “non-white/Hispanic.”
The report notes that all forms of shared transit tend to be established first in dense, urban neighborhoods, which also tend to be higher-income. But when looking at places with the greatest opportunity to absorb more modes, the report says those dense urban cores still have the highest potential. In the downtowns of small cities — which tend to be walkable, if no longer employment centers they once were — the report finds new modes like bike share could spur economic development. With good planning, the report finds that moderately dense neighborhoods, where car ownership tends to be higher than in urban cores, have the highest potential to reduce car ownership through the expansion of services like car share. Inner-ring suburbs and outlying communities with a need for first last mile connections to transit also score high on the opportunity index.
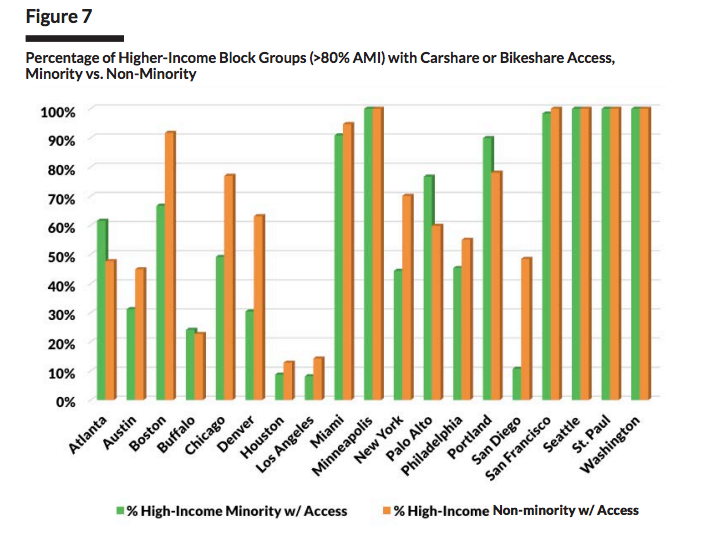
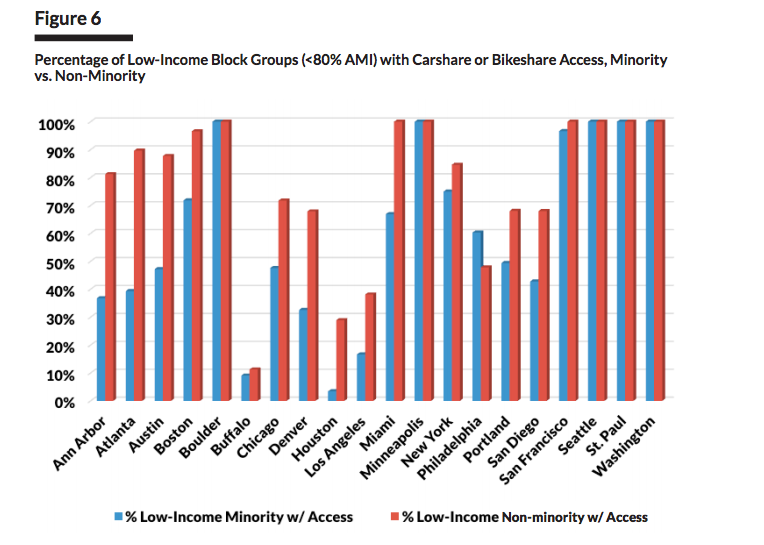
But the need and opportunity really stands out in densely populated, low-income neighborhoods. Breaking down neighborhoods first by their majority racial and ethnic characteristics and then by income, the report finds deep disparities. In Chicago, for example, 72 percent of low-income neighborhoods that are majority white had access to car-share or bike-share. Only 48 percent of low-income neighborhoods that are majority non-white did. Even minority-majority neighborhoods where residents earned more than 80 percent of area median income had less access: Only 49 percent had car- or bike-share, compared to 77 percent of majority white neighborhoods with similar average income.
To help cities address the inequity of these largely private services, the SUMC report then dives into policy recommendations. Number one: For services that are public, like bike-share, cities should embed requirements in Requests for Proposals to expand services to low-income neighborhoods and underserved populations, such as Philadelphia’s Indego and LA’s recently launched Metro bike-sharing systems. Philly’s has been widely hailed as a leader in requiring that the system serve low-income communities, in part by explicitly defining which geographic areas must receive access.
D.C. has even mandated a similar requirement for private, one-way car sharing companies like car2go. Providers there are required to maintain one percent of its fleet in each ward of the city at any point in time. And the DDOT also requires that a set number of vehicles must be located in low-income neighborhoods identified by the agency, even if they are not locations desired or requested by the car-sharing provider. SUMC cites the policy as an example for one of its other recommendations: Mandate equity.
Other policy recommendations include aggressively experimenting with new transit mode pilots, eliminating parking minimums and requiring that shared mobility operators share their data — as Boston has done.
All of the tools can be found here.
Jen Kinney is a freelance writer and documentary photographer. Her work has also appeared in Philadelphia Magazine, High Country News online, and the Anchorage Press. She is currently a student of radio production at the Salt Institute of Documentary Studies. See her work at jakinney.com.
Follow Jen .(JavaScript must be enabled to view this email address)