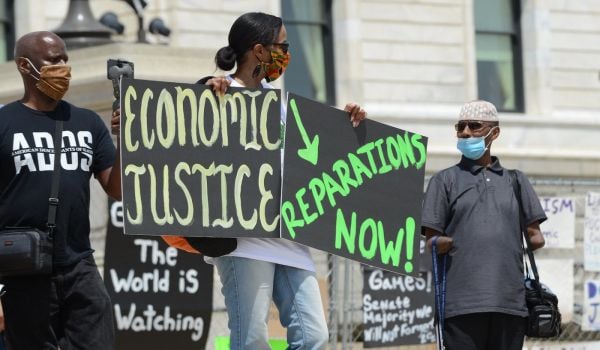
Though their economies tend to be high-performing, the counties in the San Francisco Bay Area have some of the worst racial disparities in the entire state of California.
In the city of San Francisco, life expectancy for Asian residents is 14 years longer than for black residents. The median income of white households is more than three times that of black households. When it comes to access to quality housing, the crisis is increasingly well documented. But what often goes unsaid is that racial disparities in housing are greater in San Francisco than in any other county in California, with white renters typically keeping around $57,000 in income after housing costs, as opposed to less than $30,000 for Asian and Latino renters.
These figures and thousands more are collected on a new interactive website called Race Counts, a wide-ranging data-gathering initiative from the civil rights organization Advancement Project California. Launched in November, Race Counts provides data on dozens of disparity indicators across seven categories: economic opportunity, healthcare access, education, housing, democracy, crime and justice, and a healthy built environment.
The data is broken down by county, and used to compare places on both their performance in key areas and the racial disparity in the same areas. (San Francisco, for instance, is a high performance/high disparity county.) The goal of the initiative is to equip organizers and advocacy groups with as much data as they need to win battles in the war against racial disparity in California.
“We constantly use proxies like income or ZIP code to get to that disparity question,” says Megan McClaire, director of health equity for Advancement Project California.
Research began for Race Counts in 2014, and the website pools information from dozens of partner organizations, specifically on racial disparities. Other projects have tackled questions of disparity in cities — like the effort to uncover racially restrictive deeds in Minneapolis — but Race Counts may be unique in the sheer quantity of information it’s gathered into a coherent picture.
“The beauty of the data is that it tells a way more nuanced picture,” McClaire says.
Advancement Project California is not shy about how it wants the data to be used. In the introduction to a report accompanying the data maps, the group lays out a starkly moral narrative about California’s development and the myths contained in its self-image as both a Golden State and a “blue paradise.” Known for its Democratic politics, the group says, California’s policies still leave too many poor communities of color behind.
“California still struggles with the undigested legacy of a long and unique history of racism,” the report reads. “Understanding that history requires, first, acknowledging the very roots of the settler colonialism upon which California was founded — the theft of Native tribes’ land and forced labor that was frequently justified with cultural and racial chauvinism.”
McClaire says the group has watched disparities in some areas even as the state has changed.
“As demographic populations were shifting there were areas where disparities were continuing to persist, like in South L.A., and areas where disparities were beginning to emerge for people of color, as we moved inland,” she says.
Disparities are greatest in the category of criminal justice, which includes indicators like truancy arrests, curfew arrests, fatalities from police encounters, diversity of police, incarceration rates, access to reentry services and perceptions of safety.
Los Angeles is ranked as both a low-disparity and low-performing county, but with a population of nearly 10 million, disparities there affect the greatest number of people in the state. In terms of the diversity of its elected officials, L.A. is among the least disparate counties in the state. But it ranks high on disparities in housing, crime and justice, and built environment indicators. Black Angelenos are 100 times more likely to be incarcerated than Asians, the report shows, while Asian residents have higher levels of contaminants in their drinking water than other racial groups in the county.
Even the areas with the highest performance and lowest disparity are qualified as places with “Gains at Risk” in the report, highlighting the organization’s focus on making equitable improvements in all parts of the state. McClaire says that as far as policy solutions are concerned, Advancement Project California hopes that diverse coalitions of local organizers will use the data to come up with their own ideas. The data doesn’t point to a one-size-fits-all approach to tackling disparity across the state, she says. But the need to address disparities exists across California.
“Just because you’re the best performing and the lowest disparity in housing,” McClaire says, “we’re still in a housing crisis in every area of our state.”

Jared Brey is Next City's housing correspondent, based in Philadelphia. He is a former staff writer at Philadelphia magazine and PlanPhilly, and his work has appeared in Columbia Journalism Review, Landscape Architecture Magazine, U.S. News & World Report, Philadelphia Weekly, and other publications.
Follow Jared .(JavaScript must be enabled to view this email address)


