At the Federal Reserve Bank of St. Louis’ community development division, researchers recently unveiled a new tool: The Community Investment Explorer has data from more than 500,000 community development transactions, going as far back as 1987, that are sortable by year, investment purpose, and state or metropolitan area. The three sources: the work of community development financial institutions (CDFIs), the New Markets Tax Credit (NMTC), and the Low-Income Housing Tax Credit (LIHTC).
It’s a timely effort, as the federal budget proposed by House Republicans proposed to nix the NMTC program as well as a key component of the LIHTC program.
“We know there’s a lot of groups, be it affordable housing developers, CDFIs, tax credit investors, in addition to policymakers, interested in this information and to see the stories this data tells,” says Mike Eggleston, a community development specialist at the St. Louis Fed who oversaw the project.
As secretive and opaque as the financial world remains, there is more publicly available data on the sector in the U.S. than just about any other in the economy. In combination with laws like the Community Reinvestment Act (CRA) and good old-fashioned community organizing, financial sector data have helped communities fight back against historic discrimination by banks and other lenders.
You can look up how much in deposits are held in every single federally insured bank branch in the country, updated annually. You can look up the financials for all 5,000 regulated banks in the country, including total deposits, total loans and other assets, income statements and more. You can find the same for the nation’s 5,600 federally insured credit unions. You can also easily find how much is currently invested in stock markets and bond markets and how much more was invested in the past year.
When it comes to lending, you can look up every home mortgage application, including those that were denied, and sort them by geography or race, to uncover disparities. A pending rule from the Consumer Financial Protection Bureau (CFPB) could potentially make similar data available for small business loan applications. Starting in 1989, CRA examinations became public, providing detailed accounts of banks’ attempts to satisfy their CRA obligations to meet the credit needs of low- and moderate-income communities. You can find those examinations at the websites of the FDIC, Federal Reserve, or Office of the Comptroller of the Currency.
But just because data is available doesn’t mean it’s automatically useful, or user-friendly. As part of its mission to maintain the integrity and stability of the financial system, researchers at Federal Reserve Bank branches around the country have put time and resources into making financial and other data more useful to more people. The Federal Reserve Bank of St. Louis is something of a leader among the 12 branches in this space; it’s the home of FRED, a massive treasure trove of constantly updated graphs and charts that dig deep into many data sources, including those above, and present them in a more accessible way.
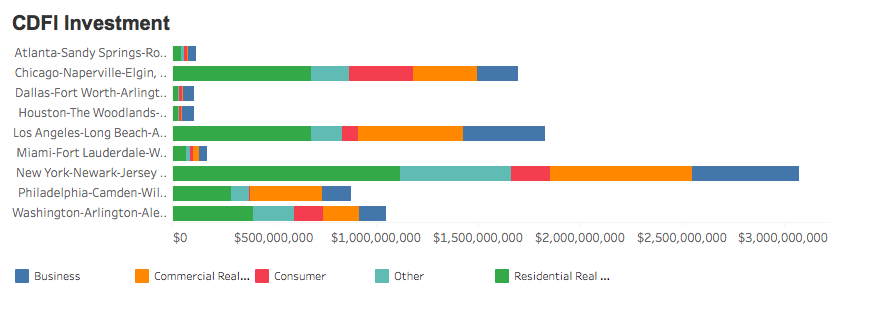
The new Community Investment Explorer builds on that existing tool set from the St. Louis Fed, shedding light on some interesting patterns, like some huge disparities in the amount of CDFI activity among the largest metros in the country. As you might expect, places like NYC, Los Angeles and Chicago lead the way on CDFI investment — yet Houston and Dallas are far behind smaller metros. Miami and Atlanta are lagging too.
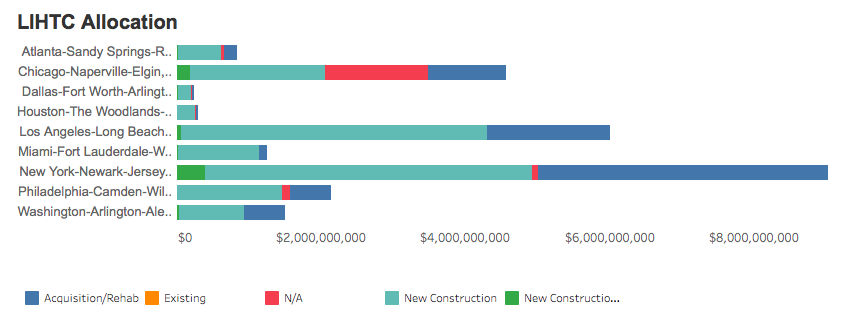
It’s a similar pattern for LIHTC investments.
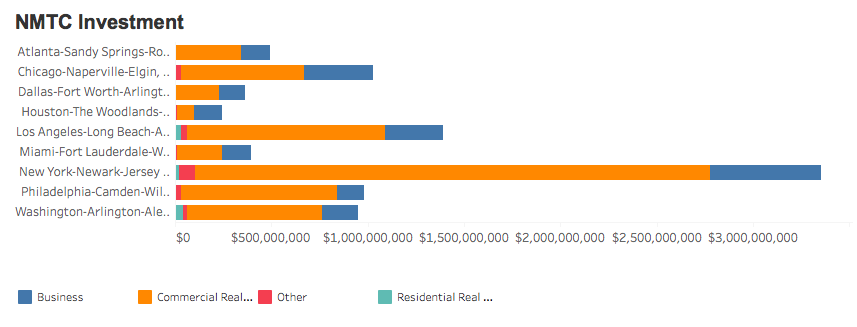
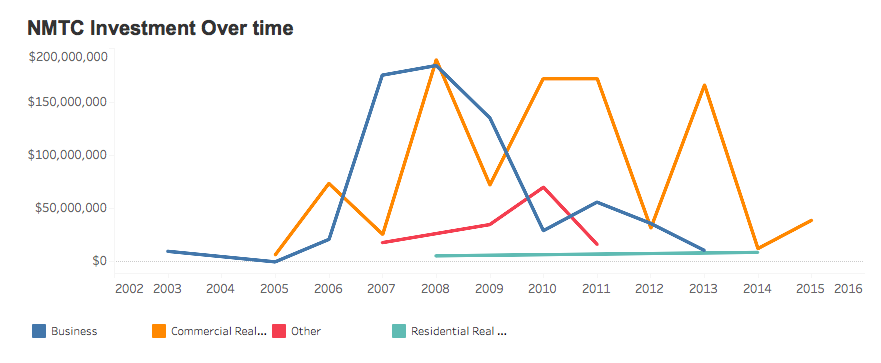
On NMTC investment, similar.
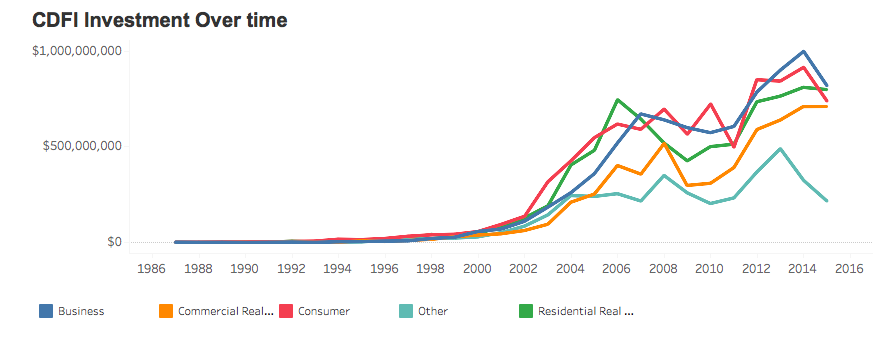
Overall CDFI investment barely grew until the 2000s, followed by a rapid period of growth until the financial crisis, then another period of growth coming out of the crisis.
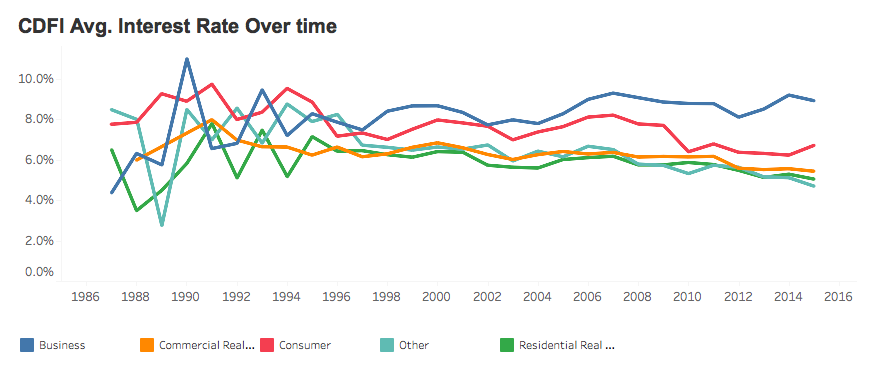
Interest rates also tell an interesting story, hovering mostly between 5 and 8 percent on everything except for small business lending, which has risen over time.
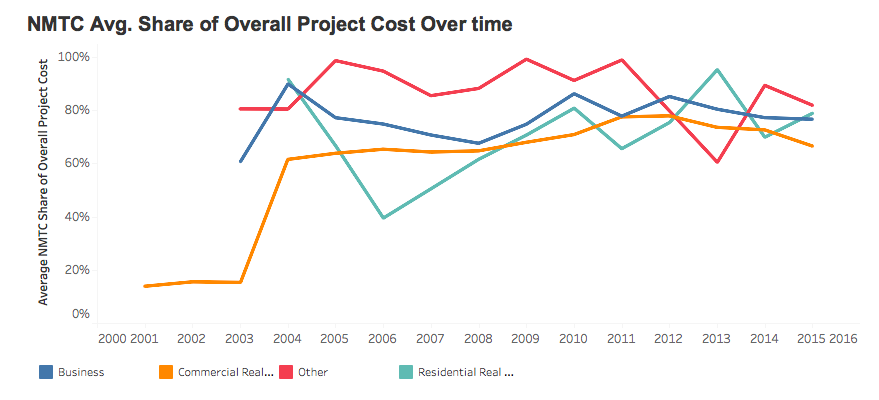
The NMTC story over time has shown that it has rapidly become a vital funding source for the projects it supports, with NMTC investments converging between 70 and 80 percent of total project cost. Combine that with other analysis published this year showing NMTC investments are generally going to the most vulnerable census tracts around, and you get a clearer sense of just how vital the program is for spurring community development where no one else wants to invest.
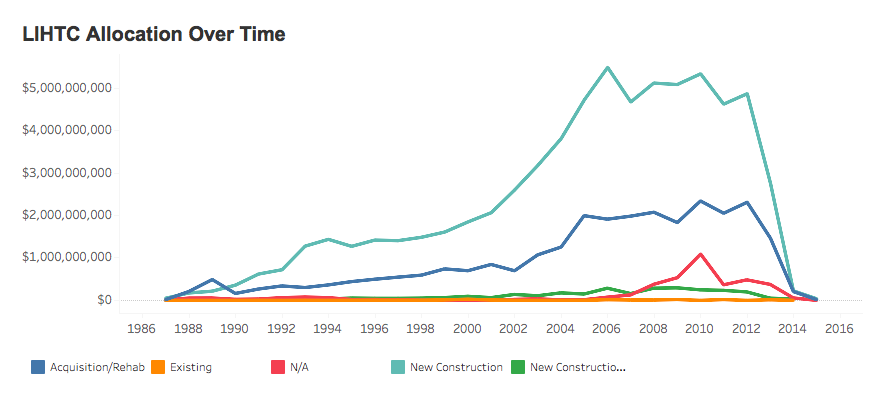
On the LIHTC side, one interesting pattern to note is the dramatic leveling off of LIHTC financing after 2006. The lack of continued growth in the program may explain a large part of today’s acute shortage of affordable housing.
And of course, there are many interesting stories to tell on a city-by-city basis. Daniel Davis, community development officer at the St. Louis Fed, points out the role of NMTCs in post-Katrina New Orleans.
“You can see right away how that program was very critical to restoring commercial real estate and operating funds for businesses,” Davis says.
“There’s so many data stories to tell out of this tool, and we’re really just starting to unpack what’s there,” Davis adds.

Oscar is Next City's senior economic justice correspondent. He previously served as Next City’s editor from 2018-2019, and was a Next City Equitable Cities Fellow from 2015-2016. Since 2011, Oscar has covered community development finance, community banking, impact investing, economic development, housing and more for media outlets such as Shelterforce, B Magazine, Impact Alpha and Fast Company.
Follow Oscar .(JavaScript must be enabled to view this email address)