The U.S. Census Bureau released a new tool today, “Young Adults Then and Now,” that mashes the info gathered about 18- to 34-year-olds in censuses from 1980, 1990, and 2000, and the 2009-2013 American Community Survey. The result is a robust, mapped-up, color-chartful presentation of numbers via dropdown menus and metro drilldowns that you could easily spend an afternoon eyeballing.
Among the notable stats: “The percentage of young adults today who are foreign born has more than doubled since 1980 (15 percent versus 6 percent).” And while millennials have more college degrees than then-younger baby boomers did in 1980, currently, “one in five young adults lives in poverty (13.5 million people), up from one in seven (8.4 million people) in 1980.”
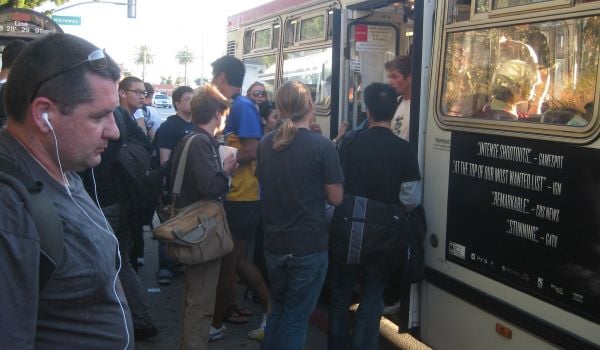
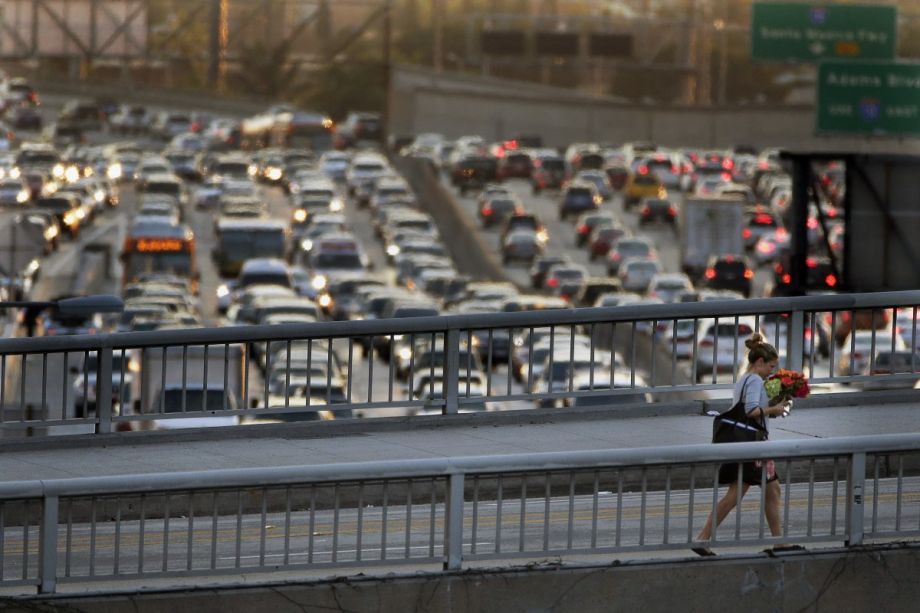
While this new tool will undoubtedly fuel scores of articles pitting one generation against another — an American national pastime — given the recent focus on the millennial preference for walkable urbanism and public transportation, we zeroed in on how the commuting habits of today’s younger adults stack up against those of past generations in 14 U.S. metros.
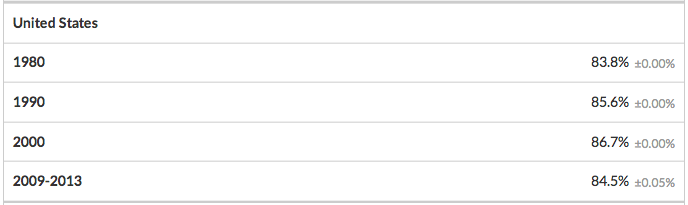
For context, here’s how the number of young people driving to work has changed nationally since 1980.
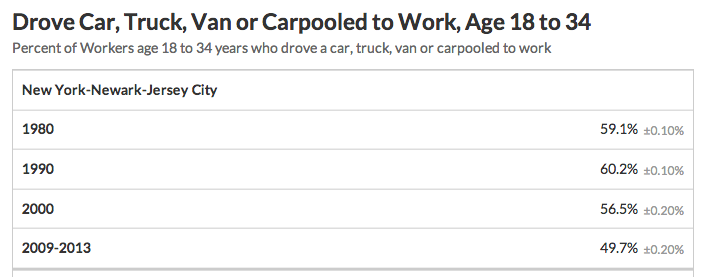
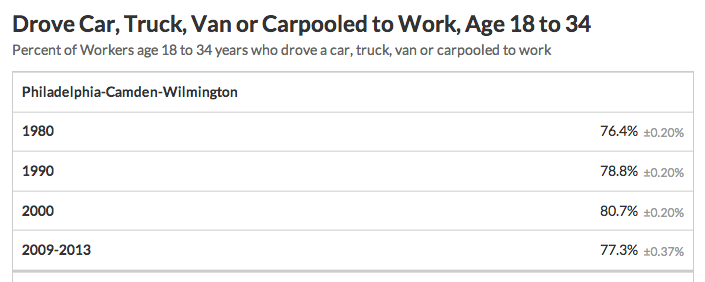
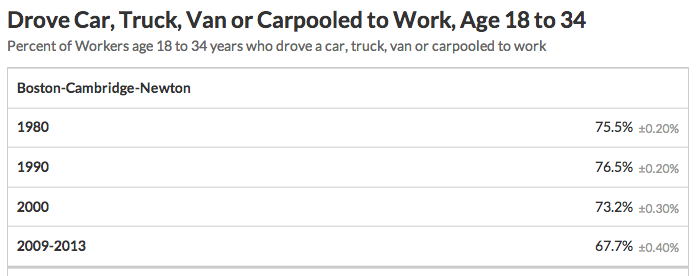
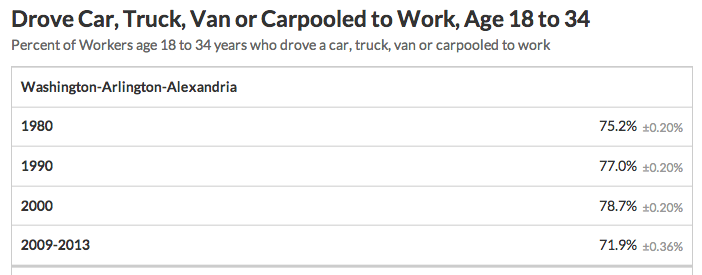
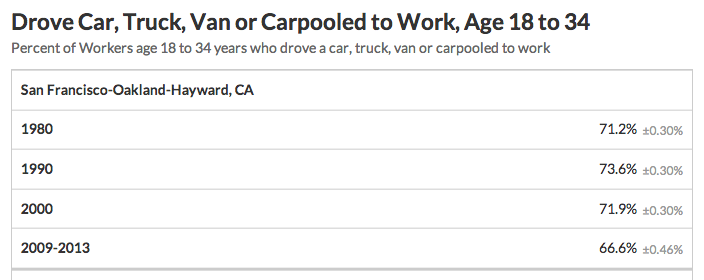
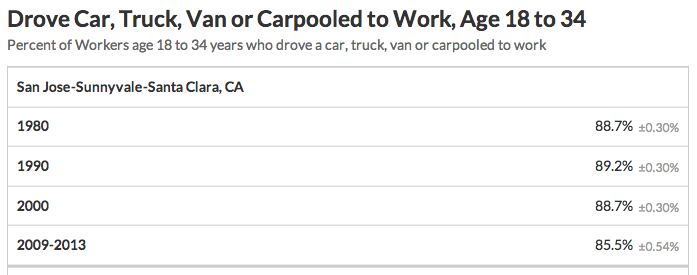
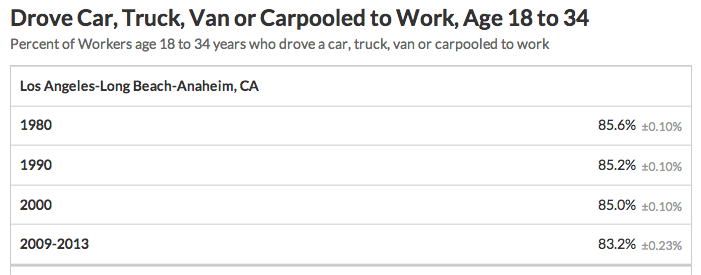
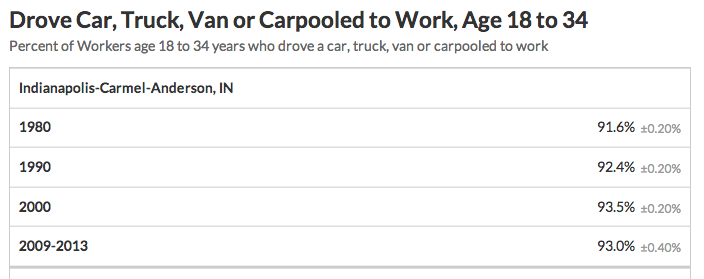
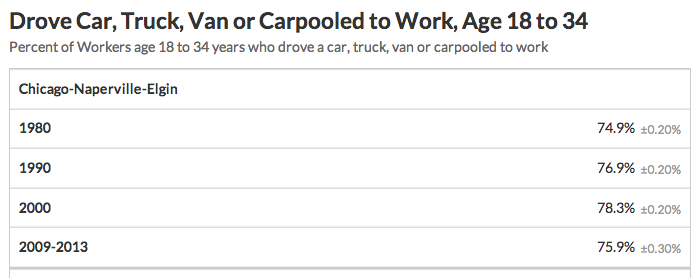
And here are the drive-to-work changes in 14 U.S. cities.
New York-Newark-Jersey City
Philadelphia-Camden-Wilmington
Boston-Cambridge-Newton, MA-NH
Washington-Arlington-Alexandria, DC-VA-MD-WV
San Francisco-Oakland-Hayward, CA
San Jose-Sunnyvale-Santa Clara
Los Angeles-Long Beach-Anaheim
Indianapolis-Carmel-Anderson, IN
Chicago-Naperville-Elgin, IL-IN-WI
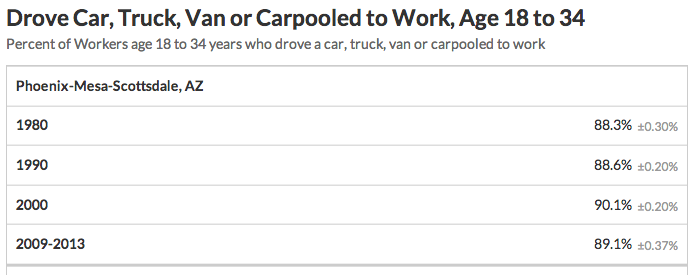
Phoenix-Mesa-Scottsdale
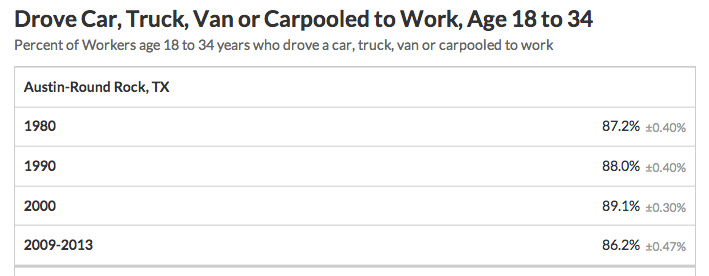
Austin-Round Rock
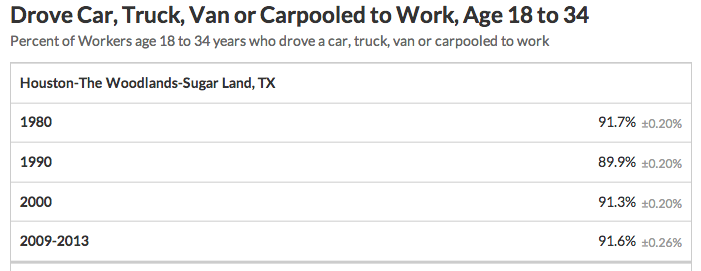
Houston-The Woodlands-Sugar Land
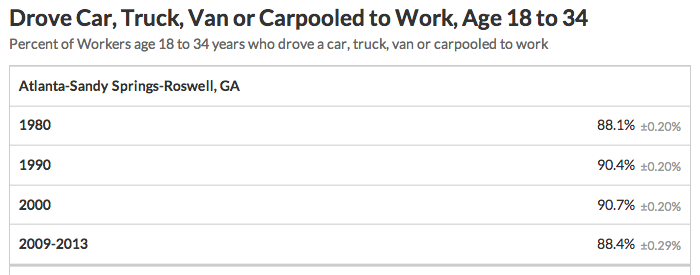
Atlanta-Sandy Springs-Roswell
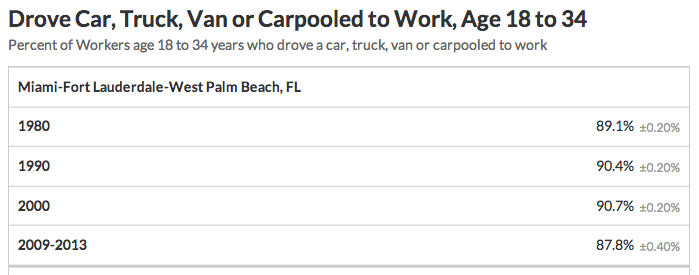
Miami-Fort Lauderdale-West Palm Beach
The Works is made possible with the support of the Surdna Foundation.