For decades, demographers have been predicting that around 2050, whites will no longer make up the majority share of the U.S. population. Children under the age of 6 are already there: More than half are black, Asian, Latino, Native American, Pacific Islander or some combination. By 2020, the majority of all U.S. children won’t be white.
But shifting demographics have not been matched with equal opportunity, often leaving children of color disadvantaged compared to their white peers — living in neighborhoods with higher rates of poverty, attending more segregated schools, even when their families have similar incomes. A comprehensive new tool by diversitydatakids.org compiles a staggering array of data about children’s neighborhood environments, much of it broken out by race or ethnicity and socioeconomic status. Ample research has shown that a child’s neighborhood environment bears heavily on well-being and life chances, even after they move elsewhere. The tool allows users to compare how states, counties, metro areas, large cities and large school districts rank in terms of childhood inequity. It even includes neighborhood-level “childhood opportunity” maps of the country’s 100 largest cities.
At the bottom line, the tool reveals black and Hispanic children are not living in worse neighborhood environments simply because they live in poorer families. Across the 100 largest cities, the average poor black child lives in a neighborhood with a poverty rate of 35.4 percent, while the average poor white child lives in a neighborhood with a poverty rate of 24.4 percent. Black and Hispanic children who are not poor are still almost as likely to live in neighborhoods with high poverty rates as are poor white children. In other words, regardless of family income, black and Hispanic kids are more likely to live in disadvantaged neighborhoods.
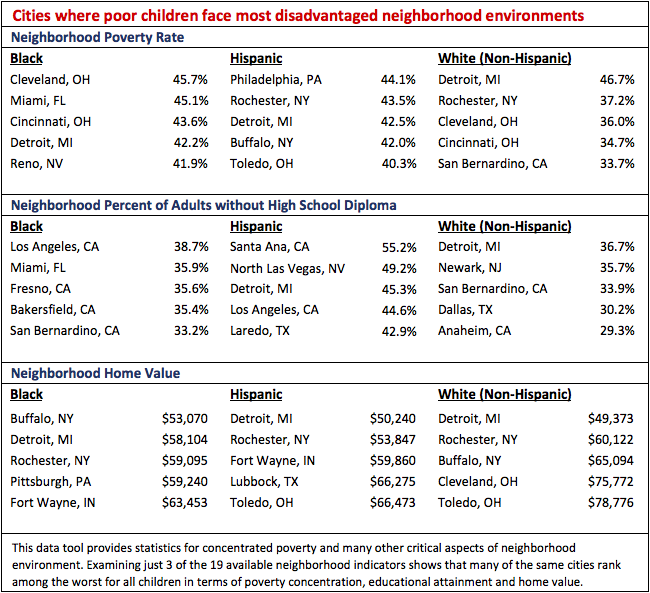
(Credit: diversitydatakids.org)
Such racial divides are everywhere evident across over 19 different indicators of neighborhood environment, and over 200 other indicators compiled as part of the diversitydatakids.org database, which is a research project based at the Heller School for Social Policy and Management at Brandeis University near Boston.
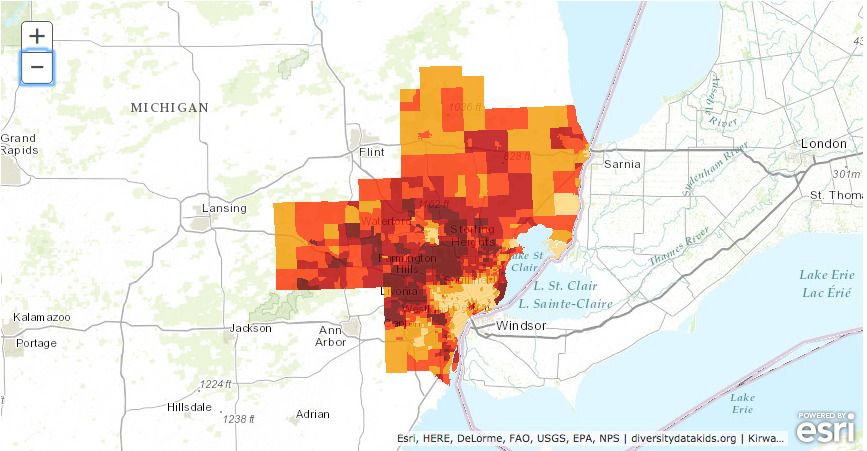
With the tool, users can see a city’s population under the age of 18 broken out by race or ethnicity, the changes in that population between 2000 and 2010, the share of children living in high-poverty neighborhoods, the composition of public school enrollment, exposure to other children in poverty, and several measures of school and neighborhood segregation. For some stats, data is also available specifically for young children, under the age of 6. In addition to profiles of individual cities, the tool allows users to rank geographic areas to see how they compare.Doing so produces some surprises. The city where the highest share of black children are living in high-poverty neighborhoods? Nope, not Detroit. Miami, where 95 percent of black children do. Detroit tops the list for white children (94.4 percent live in a high-poverty neighborhood) and Hispanic children (98.4 percent).
The city with the highest level of residential segregation among Hispanic children is Oakland. For black children, it’s Chicago, and for Asian/Pacific Islander children, Detroit. (Not enough data is available on Native American or Alaskan Native children on this stat.) Levels of school segregation — which, like residential segregation, is measured by the evenness with which children from different racial or ethnic groups are spread across a geographic area — are highest for black and Asian children in Newark, and for Hispanic children in Oakland.
The tool can also be used to create maps that compare indicators across states. And the “Childhood Opportunity” feature zeroes in on individual cities to map childhood opportunity — measured by an index that takes into account educational access, healthcare access, and social and economic opportunities — on a neighborhood level.
Jen Kinney is a freelance writer and documentary photographer. Her work has also appeared in Philadelphia Magazine, High Country News online, and the Anchorage Press. She is currently a student of radio production at the Salt Institute of Documentary Studies. See her work at jakinney.com.
Follow Jen .(JavaScript must be enabled to view this email address)