There’s a study behind every urban planning improvement project. Yet how does one effectively analyze that complex entity we call a “city”? In the second installment of her new column, Jeanne Haffner will explore the technological and conceptual devices that planners and others use to do just this. This is the third installment of Street Science; to see the first two, click here and here.
What I love about exploring methodological issues is the way it allows me to reflect upon the world and attempts to conceptualize and shape it.
Even more enjoyable, however, is finding a like-minded soul who gets as excited about methodological questions as I do. I recently found such a person in Ryan Sullivan, a designer and planner at Utile, Inc., a top Boston-based firm known for its excellent staff and innovative approach. I spent a fascinating afternoon conducting ethnographic fieldwork at their design studio in downtown Boston, and Sullivan was my chief “informant.”
My goal was to understand the importance of graphic representation in his day-to-day work. As an example, Sullivan pointed to the Stuart Street Planning Study, a project that Utile carried out for the Boston Redevelopment Authority (BRA) in 2007-2008. By examining this specific case, I came to understand that graphic representation not only helps designers like Sullivan analyze a particular problem or set of problems. It also aids them in constructing a coherent narrative and convincing argument about the area at hand that can be easily communicated to others — a crucial part of the planning process.
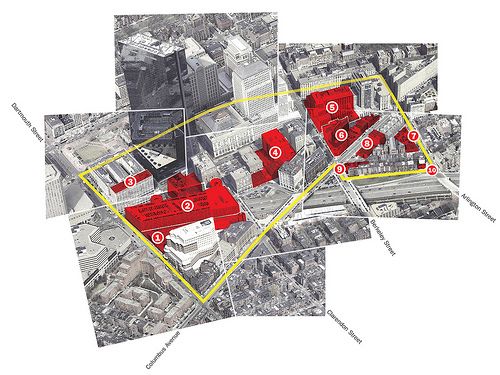
Despite its title, the Stuart Street Planning Study did not focus on a single street. Rather, the study involved an important ten-block area of downtown Boston between the South End and Back Bay that includes I.M. Pei’s famous Hancock Tower. The zoning regulations developed for this area in the 1980s were intended to control growth, especially the vertical variety. But in subsequent decades, getting around these regulations had become more the norm than the exception. Responding to public interest, the BRA asked Utile to investigate the amount of growth this area could actually handle, and what modifications to existing zoning regulations they would recommend.
Each month for eighteen months, Sullivan and others presented their ideas to a diverse Advisory Group. He used maps to synthesize data from different reports so that the information was more accessible and compact. “This [information] was all written,” he said, “until we made these maps…[now] we can see it together and have a conversation.” Sullivan also put together a series of historical maps showing the evolution of the area over time, and how it overlaps with neighboring districts.
But graphic representation had an even deeper function: It helped the Utile team understand this particular urban space as it presently exists. From this standpoint, they developed ideas for its future form and functions. In other words, graphic representation supported their endeavor to use reality as a starting point, rather than abstract ideas. As Sullivan explained, “The way we attacked the problem — rather than saying what the ideal scenario was right off the bat, we looked at what was there and what could be done there, making sure it was realistic.”
This single example shows that abstract graphic representation can actually be used to combat abstract thinking and get closer to the reality of the situation, rather than the opposite. Perhaps Jane Jacobs herself might have benefited as well from a conversation with Ryan.
For questions about this piece, or suggestions for future columns, please contact Jeanne Haffner at streetsciencenac@gmail.com