When you think about the most pressing problems in urban America, the word multifaceted comes to mind. To break the cycle of intergenerational poverty, we need to be looking at education. To improve education, we need to look at zero-tolerance policing. And so on.
That’s especially true when it comes to health. The contributing factors are complex. Finding novel interventions to intractable problems like obesity and opioid overdoses, for example, require looking at data from a variety of areas both within and outside of healthcare fields. But these numbers exist in disparate data sets, often compiled by different organizations, with different methods — so they tend not to be so easy to manipulate.
Enter a new tool for policymakers, researchers, and civic leaders to explore these connections in one place, the City Health Dashboard. Launched by the Department of Population Health at NYU School of Medicine last week, the database presents an easy-to-navigate alternative to the U.S. Census Bureau’s American Fact Finder that brings together city-level and neighborhood-level numbers related to not only health but also its upstream and downstream factors — such as employment, housing and chronic absenteeism from school.
“It’s not a site that’s only about health or healthcare. It takes a broader view of what is health all about — what really produces health in our society?” says Dr. Marc Gourevitch, chair of the Department of Population Health at NYU and the lead researcher on the project. “We’re bringing together data not just about health but about what drives health, in one place, so that coherent conversations can be had in setting priorities and thinking about what we can do to improve population health and health equity.”
The interface was designed to make connections across the raw information hidden in its data, which includes a wide array of datasets pulled from the Centers for Disease Control, the Census Bureau, and other sources, covering the 500 largest American cities.
The dashboard began as a pilot project in 2017 involving four partner cities: Providence, R.I.; Waco, Texas; Kansas City, Kan.; and Flint, Mich. The team quickly realized that more peer comparisons were needed in order to best inform the public health experts, urban policy scholars, and lawmakers they intended to be the primary audience.
“The idea for the dashboard came about from a recognition that most health data in the U.S. turned out to be organized at the county or state level. City leaders and community leaders lacked the granular data about health and its determinants at the level that they are responsible for or living in,” says Gourevitch.
Working with colleagues at NYU’s Wagner Graduate School of Public Service and the National Resource Network, which works with economically distressed cities, the City Health Dashboard team heard from a lot of the mayors and city managers who expressed interest in health as one of their top agenda items, but it wasn’t, essentially, because they were lacking data to manage against.
Often, it’s not a void of data that impedes public health progress as much as it’s a lack of standardization and organization. That’s why the City Health Dashboard team put a premium on careful data choices and thoughtful design. An advisory committee — comprising leaders in public health, elected officials, and researchers across the country — gave input on the project along the way.
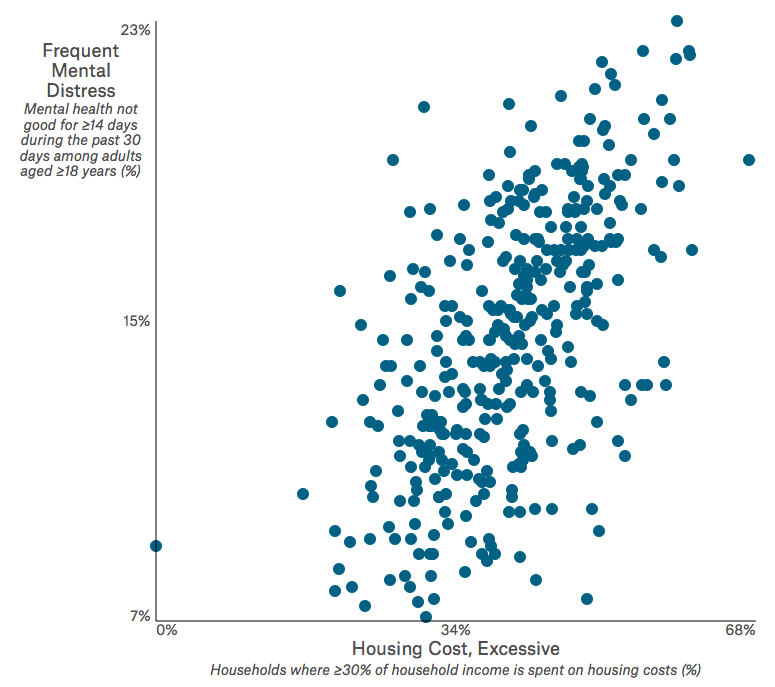
The City Health Dashboard also produces custom scatter plots, like this one showing the relationship between frequent mental distress and households spending 30 percent or more of their income on housing. Each dot represents a census tract in Philadelphia. (Credit: City Health Dashboard)
Along with NYU, partners on the project include the Robert Wood Johnson Foundation (the primary funder), the National League of Cities, the National Resource Network, and the International City/County Management Association.
“We were involved with making sure that this is a resource that’s usable for local governments and is designed for them,” says Andrea Fox, deputy director of global programs at the International City/County Management Association.
The finished product, Fox says, encourages the complex connections that cities increasingly need to make in order to achieve positive outcomes across sectors. In some of the efforts Fox says the association has been involved with in terms of sustainability planning, the topic of access to dental care has come up a lot — not necessarily a traditional sustainability measure. “But it’s related to health, which is related to sustainability. People need to find new connections through data,” says Fox.
That’s why “[the dashboard] is a powerful tool,” Fox says. “[Local government] may go in there looking for information on opioid overdose and may come out looking at dental records.”

Malcolm was a Next City 2015 equitable cities fellow, and is a contributing writer for the Fuller Project for International Reporting, a nonprofit journalism outlet that reports on issues affecting women. He’s also a contributing writer to POLITICO magazine, Philadelphia magazine, WHYY and other publications. He reports primarily on criminal injustice, urban solution and politics from his home city of Philadelphia.