How tall is every building in the world? Why do cities grow? How many cities are there in the world? If a house is surrounded by a large yard, should the property be considered predominantly built-up or open space?
These questions might sound like the set-up to a Zen koan – well, the last admittedly sounds more like a wonky debate for a zoning hearing – but in fact these queries have answers, driven by high-resolution satellite imagery that a team at the European Commission’s Joint Research Centre has pored over in the latest evolution of the Degree of Urbanization project.
The Degree of Urbanization project’s use of remote sensing to estimate the size of cities debuted in 2018. Its findings contested widely accepted figures published by the United Nations’ World Urbanization Prospects, which rely on self-reporting from countries, many of whom have wildly inconsistent definitions in how they define “urban.” The Degree of Urbanization project’s standards divide the world’s human settlements into cities, towns, semi-dense areas and rural areas. Based on that data, two years ago, the European Commission and the OECD unveiled a digital tool that pegs the world’s total number of cities at 10,000 – and discovered half of them didn’t exist 40 years ago.
While such claims were headline-grabbing, the researchers’ goals are more quotidian: They want to embed this new, and they believe more accurate, definition of urbanization into the world’s demographic institutions in order to help answer these pressing questions.
To that end, the researchers have recently inked agreements that will code the Degree of Urbanization definition on gold standard datasets, like the Gallup World Poll and the World Bank’s Living Standards Measurements Study. The research team is also in the process of analyzing urban population by age and sex from 1950 to 2100 in order to better understand past and projected urban growth factors – natural changes (births minus deaths), net migration and city territorial expansion.
“There’s a huge debate about what drives urban growth and this data will allow us to quantify that in a rigorous manner,” Degree of Urbanization lead researcher Lewis Dijkstra told Next City at World Urban Forum 11, held in June in Katowice, Poland.
Scholars and policymakers rely upon those datasets to craft public policy. Once complete a public official looking to make strides on domestic violence will have a more accurate picture on discrepancies between urban and rural areas. Or an education department will be able to benchmark their country’s urban students.
“It’s typical that education is higher in cities, but how are my cities doing compared to the cities in the country next door?” Dijkstra said.
Policymakers can have confidence that they are truly comparing apples to apples thanks to the European Space Agency’s Sentinel satellites, which provide open access imagery of the entire planet’s surface at 10 x 10 meter resolution, or about 1,075 square feet intervals.
Given that the average U.S. detached home lot is just over 8,000 square feet, this level of resolution has allowed the researchers to fine-tune their analysis. Previously they relied on 30 x 30 meter resolution, which is nine times lower resolution than the current imagery. With the older resolution, they classified every 1,000 square meter (10,764 square feet) grid cell as either “built up” or “not built up.” But with this higher resolution imagery, the researchers can indicate shades of gray.
“If you have a lot of scattered development, like in some U.S. cities, the share of built-up is very very high,” Dijkstra explained. “It really inflated the impression of the built-up area.” This higher resolution has also helped detect small, scattered buildings in Africa like rural huts.
With the higher-resolution imagery, Dijkstra’s team has also estimated the average building height and volume in every one of those 1,000 square meter grid cells. This three-dimensional picture sharpens the comparisons between vastly different cities. Previously two neighborhoods with the same building footprint per capita might have appeared identical, when in point of fact one was a low-rise crowded area and the other a collection of high-rises where each resident has a comfortably apportioned flat. Such assessments of potential overcrowding could help address what was a major issue in residential buildings during the COVID-19 pandemic. “It’s still quite experimental, but it’s a solid attempt,” Dijkstra cautioned.
While other urban scientists applaud the innovative use of remote sensing, they likewise caution against an overreliance on buildings as the foundational definition of what constitutes a city.
“You have to know how people move between where they live and where they work in order to get the definition right,” said Luis Bettencourt, director of the Mansueto Institute for Urban Innovation at the University of Chicago. He described this methodology as a “functional definition” in contrast with the Degree of Urbanization’s “morphological” definition.
Despite such critiques, the researchers are having success convincing decision-makers of the core argument – that empirical geospatial data can offer a more accurate depiction of cities than the wide range of definitions employed today. In 2020, the United Nations Statistical Commission endorsed the Degree of Urbanization definition, a crucial green light for individual countries to start trying the definition on for size. Since then, Brazil, Colombia, Lebanon, Indonesia, Philippines and Tunisia have all expressed interest.
“We’re trying to get a critical mass of countries in different parts of the world to lead by example,” Dijkstra said.
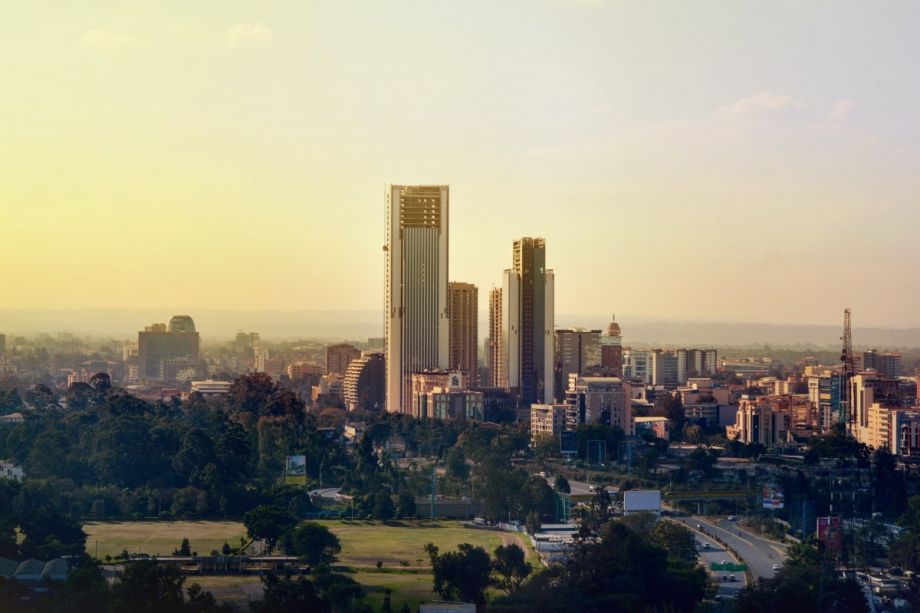
The leader of the pack is likely Kenya, which earlier this year agreed to pilot the Degree of Urbanization in Homa Bay County, which is home to five urban areas. Kenya adopted a new constitution in 2010 and passed several laws that designate population thresholds to be considered a city, municipality, town or market center. Once the analysis is complete, Kenya will be able to see how the most recent census data from 2019 compares with the reality as gleaned by satellite.
“Some cities have very old boundaries, so this more precise tool fits well in assisting us with delineation, classification, and establishment of urban institutions,” said Robert Sangori, a building scientist in Kenya’s Ministry of Land, Housing and Urban Development. Kenya’s next decennial census is in 2029, which provides ample runway to roll out the Degree of Urbanization in Kenya’s other 46 counties.
“I am optimistic that before that time we should have better boundaries in the majority of our jurisdictions,” he said.
RELATED PODCAST EPISODE
How Many Cities Are in the World? A New Way to Count
Until recently, there wasn’t any standard definition of a city. Now researchers know how many cities are in the world and can finally make comparisons across countries and continents.
EDITOR’S NOTE: We’ve corrected Rudiger Ahrend’s title.

Gregory Scruggs is a Seattle-based independent journalist who writes about solutions for cities. He has covered major international forums on urbanization, climate change, and sustainable development where he has interviewed dozens of mayors and high-ranking officials in order to tell powerful stories about humanity’s urban future. He has reported at street level from more than two dozen countries on solutions to hot-button issues facing cities, from housing to transportation to civic engagement to social equity. In 2017, he won a United Nations Correspondents Association award for his coverage of global urbanization and the UN’s Habitat III summit on the future of cities. He is a member of the American Institute of Certified Planners.