A city, like a good cast-iron pot, holds its heat. The 50 largest cities in the United States are, in a year-round average, nearly one degree warmer than their natural environs. At night, or at certain times of the year, that disparity grows: Las Vegas in the summer, for example, is on average more than seven degrees warmer than the surrounding desert. The differential is lower in the morning and highest after sunset. A 2014 report from Climate Central on U.S. cities recorded an incredible maximum urban heat island differential of 27 degrees.
This is a boon for al fresco dining, but the urban heat island (UHI) effect worries planners and climate scientists. Heat is already the most deadly type of severe weather, as the Centers for Disease Control and Prevention reported in 2013. Spikes in days over 80 degrees cause large declines in birth rates, a study on the U.S. between 1931 and 2010 found. And heat is projected to worsen with climate change over the course of the century, forcing cities to adapt well beyond disaster planning. Chicago, for example, has changed its planting strategy to favor trees native to Southern states.
In the search for a formula to cool cities through design, the evidence is mixed. In 2009, Toronto passed North America’s first green roof policy, mandating that new buildings of a certain size plant roofs with grass and shrubs. But some crops actually make roofs hotter, and scientists estimate it would require greening 90 percent of a city’s roof space to lower the temperature by one degree. Los Angeles now requires new and renovated homes to have light-colored roofs, to better reflect sunlight — a policy that may have the side effect of decreasing cloud formation and precipitation.
Even the most basic question about heat islands and urban design remains unanswered: Which type of city is most susceptible to the phenomenon? The dense, pre-war metropolis, like Boston or Chicago? Or the newer, sprawling city of the South and West?
According to research by Neil Debbage, a doctoral student at the University of Georgia, the answer depends on the season. Low-density cities form stronger heat islands in the winter, high-density cities in the summer. Both types are home to factors contributing to urban heat islands. Car-centric metropolises tend to feature vast areas of cleared land, impervious surfaces that reduce evaporation, and extensive suburbs that slow center-city heat dissipation. But dense cities feature greater concentrations of man-made warmth, like buildings. Narrow streets flanked by tall buildings absorb and retain heat.
Using thousands of surface temperature readings from the 50 largest U.S. cities, Debbage and co-author J. Marshall Shepherd assembled years of regional climate data. The worst UHI effects, they found, were in Salt Lake City, Miami and Louisville — but not, they suspect, because of any generalized trends. Salt Lake City is prone to temperature inversions. Miami’s wall of skyscrapers may reduce ocean-breeze cooling. Louisville, which has the fastest-growing UHI in the United States — up seven degrees since 1961 — has likely suffered due to its struggles to formulate a comprehensive tree-planting plan.
But by cross-referencing temperatures against a variety of metrics designed to quantify urban typology — which have names like “clumpiness index,” (CLUMPY), “contagion index” (CONTAG) and “area-weighted mean patch fractal dimension (AWMPFD) — Debbage and Marshall found their pattern.
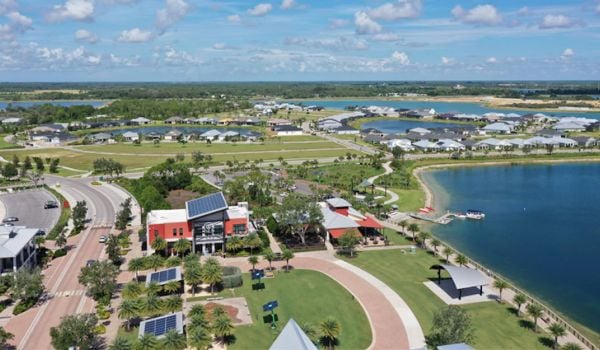
The measure that displayed the highest correlation with UHIs is called “percentage of like adjacencies” (PLADJ). Breaking down cities into pixels of 30 meters, PLADJ simply counts the percentage of pixels that abut other pixels of similar land use. It’s essentially a measure of how contiguous development tends to be. And it turns out that where one style of development (whether strip malls and single-family homes or multi-family buildings and high-rise towers) prevails over vast, uninterrupted tracts of the city, the heat island effect is stronger. Monotonous spatial arrangements make cities more susceptible to heat islands.
Contiguous, high-densities cities were more likely to display strong heat islands in June, July and August; contiguous, low-density cities displayed their stronger heat islands in the winter. Debbage has a hypothesis for why that might be. “In the summer, you have a higher sun angle, and more sunlight being trapped in these urban canyons,” he explains. “Whereas in the winter, you’d have a lower sun angle, so those tall buildings are causing shade.”
Unfortunately, that’s still bad news for the dense cities that environmentalists otherwise favor for their low per-capita energy consumption and efficient land use. The summer is the worst time to have an urban heat island.
“In the wintertime,” Debbage points out, “keeping your city warm would actually reduce the amount of energy you’re using.”
The Science of Cities column is made possible with the support of the John D. and Catherine T. MacArthur Foundation.

Henry Grabar is a senior editor at Urban Omnibus, the magazine of The Architectural League of New York. His work has also appeared in Cultural Geographies, the Atlantic, The Wall Street Journal and elsewhere. You can read more of his writing here.
Follow Henry .(JavaScript must be enabled to view this email address)


