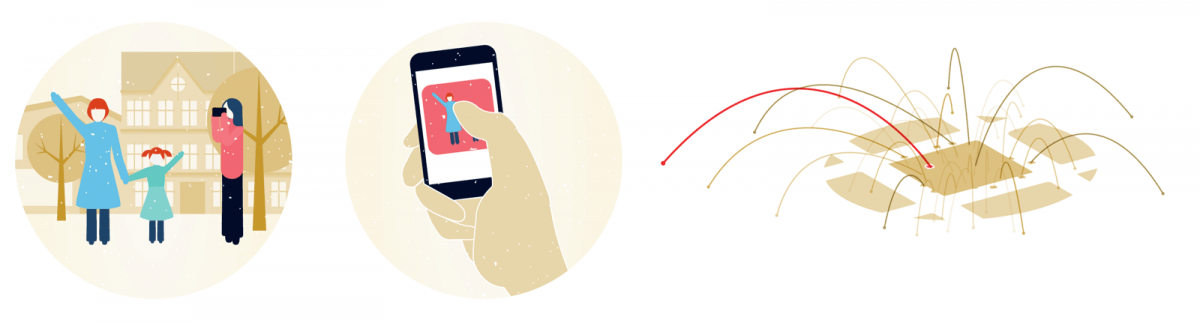
At first, it seems like voting and taking pictures have little in common.
But begin with the idea that a photo helps one memory stand taller than the others in the same way a vote bumps a candidate ahead in the race. And remember that a ballot box is a collection of people’s votes, sort of like Instagram is a collection of people’s photos.
What if we could tally up these public photos like they were votes in a ballot box?
This idea is worth exploring because there’s something about photos. I don’t take a lot of them. But when I do, I take pictures of the people I love, special events, and scenic places. My favorites combine all three.
And when I take a photo, my phone invisibly stamps it with mechanical notes, sort of like the clues written by hand on the back of an old Polaroid. Sometimes this metadata includes the location of where the photo was taken. This means that some photos can be mapped.
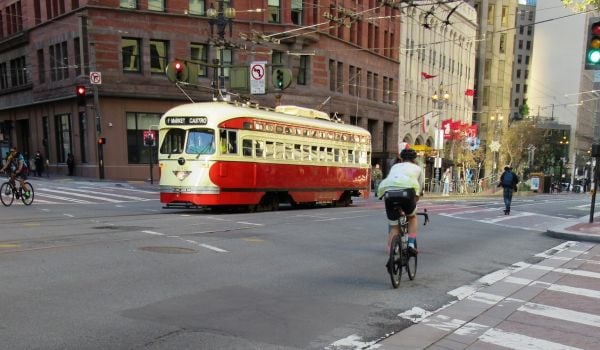
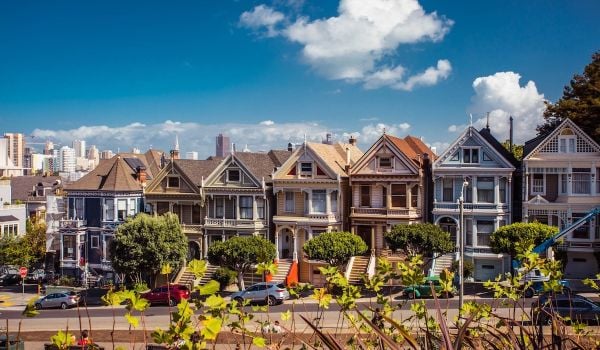
When an Instagrammer’s photos of a city are mapped together, an interesting thing happens: Parts of the map are empty, and others are crowded with photos. The best example I’ve found of this is a series of maps by data artist Eric Fischer. Fischer mapped photos he found on Flickr of San Francisco according to whether the photo was taken by a local or a tourist, based on the the invisible digital stamps embedded in the photos. The two sets of maps were completely different; tourists traveled one San Francisco, while locals saw another.
These maps hint at a new form of public engagement that can include not only the 100 people who show up at a community meeting, but also the 10,000 people who skip the meeting to spend time at nearby public spaces.
(Courtesy of Gehl Studio)
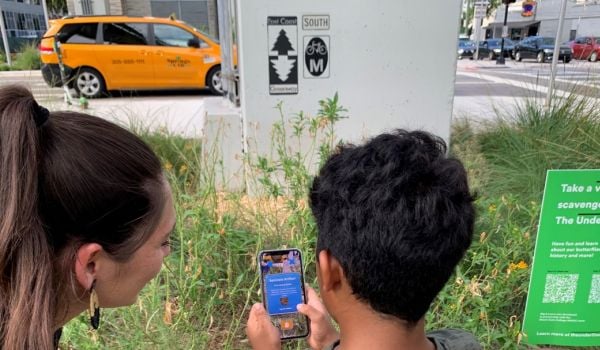
Building upon Eric’s work, my colleagues at Gehl Studio and I recently experimented with using photos to learn about the mixture of people at different places in San Francisco. We looked at Union Square, a central plaza in downtown surrounded by shopping and hotels; and Patricia’s Green, a grassy neighborhood park with benches and a playground. We were curious about the social life and demographic mixing at each of these public spaces.
Our curiosity was piqued when we went looking for a census for city streets. Unlike the census that captures where people live, there is no regularly collected dataset for where people spend time in public spaces. Places that welcome a good mixture of different people can help foster connections between cultures and across social strata. But if diversity in public space is so important, why don’t we have the tools to find it? We asked ourselves, how could people help us build this dataset automatically?
To do this, we decided to use Instagram because it is simple and popular, and there’s something special about its photos. Instagram provides a reliable, fine-grained, frequently updated dataset without any forms or complicated opt-in mechanisms. Many of us participate in this tool not as a cumbersome task, but because we want to. The low barrier to engagement of social media-related data is what we call “passive engagement” because we are able to include people passively, by carefully sifting through the compost pile of public data.
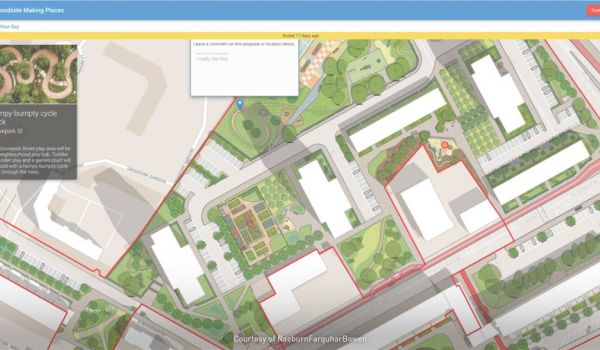
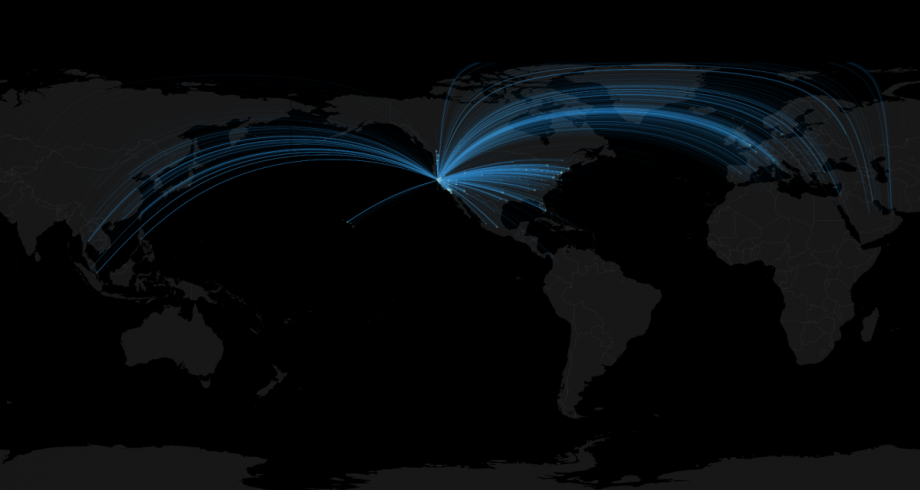
Our first test looked at the geographic reach of Union Square and Patricia’s Green. We cycled through the Instagram photos posted from each place. Then we roughly estimated where each Instagrammer came from based on other Instagram photos posted on the account.
(Courtesy of Gehl Studio)
Mapping the data globally reminded us of what we intuitively knew. Union Square is popular with tourists while Patricia’s Green had a stronger local reach, with 59 percent of its Instagramming visitors from the Bay Area.
Patricia’s Green global reach. (Gehl Studio)
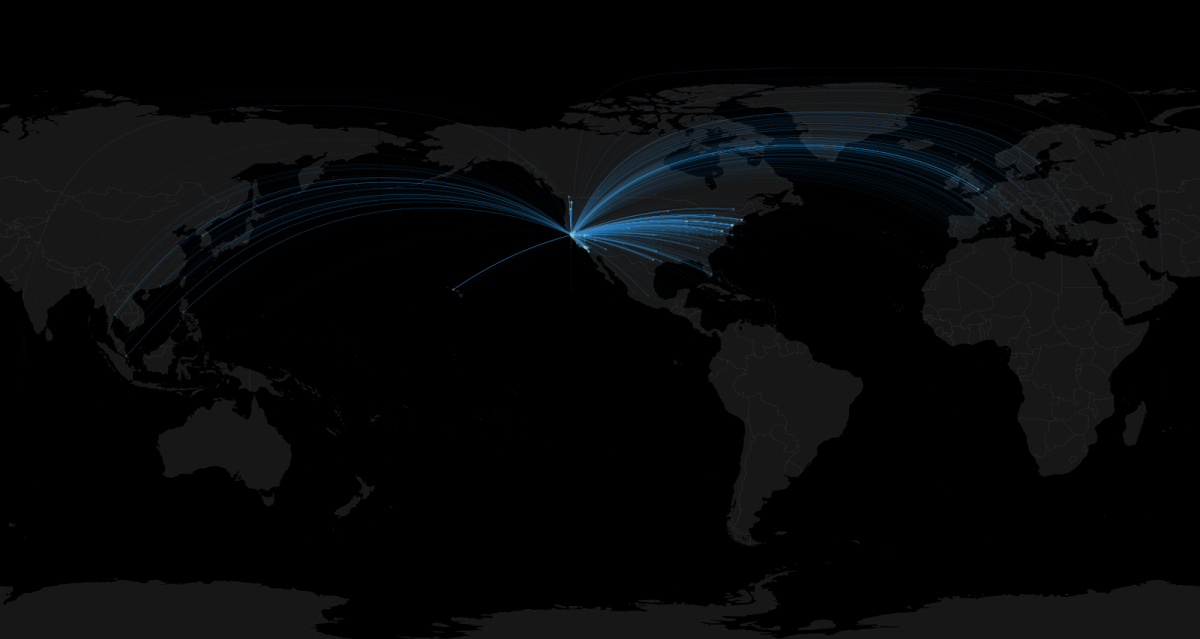
By contrast, only 38 percent of Instagramming visitors were local at Union Square.

Union Square’s global reach. (Courtesy of Gehl Studio)
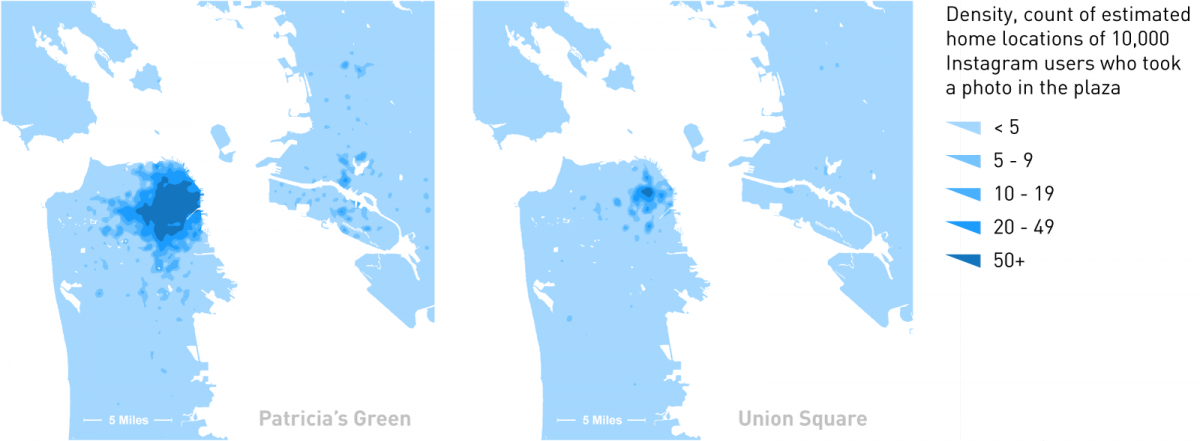
After mapping the social reach, we predicted the demographic mix of each space. We did this by seeing each Instagrammer as a representative of his or her home neighborhood. Then we drilled into the census data to get a demographic picture of the entire set of home neighborhoods represented by each place’s Instagrammers. Together, the neighborhoods of 10,000 of the most recent Instagrammers in each site helped paint a portrait of the economic diversity of these public spaces. We found that Instagrammers in both places represented a diverse mixture of incomes, and Patricia’s Green was a little wealthier and a little more employed.

(Courtesy of Gehl Studio)
Bringing census data down to the street level can help us see how economic diversity plays out in public space. And for a first test, we’re happy that 20,000 people were represented. Imagine handing out 20,000 questionnaires, or hosting 20,000 people at a community meeting.
But this tool doesn’t do it all. It gives us an overview of people in a space, and how economically different they might be. But group size, the mixture of stationary activities, pedestrian flows, and how and why different people engage with one another are all unknown.
Plus, not everyone posts photos to Instagram. 15 percent of people we interviewed at Union Square and 19 percent at Patricia’s Green used Instagram and posted in the plaza. This was a pleasant surprise because we expected it to be lower. But it’s nowhere close to including everyone. And it doesn’t tell us if people are talking to each other, or if they form lasting social bonds. And predicting a photographer’s neighborhood doesn’t tell us anything about the photographer. This is great news for privacy. But it means we are registering the places represented by people, not the people themselves.
This is why we see passive public engagement as just one tool in our toolbox. To finish the job, we enhanced our traditional analysis of pedestrians and stationary activities to include social grouping. And we used intercept surveys to investigate the triggers for unplanned social encounters. This combination of tools works together to build a better understanding of the social life and economic diversity of public places.
Even with its limitations, we think the potential is huge. This approach can help us see how people respond differently to a place over time, and how, or if, its mixture of people changes as the space changes. We can look at the details, like how a sunny day compares to a rainy day. And we can look at the bigger picture, like how providing more room for sitting and walking affects the social and economic composition of the people using a space.
If we scale this tool up, we can imagine a whole new map of the city – a place diversity map. A better understanding of how different places invite different mixtures of people can help us make places that are inviting for everyone. Instead of experts picking sites from the top-down, the photo-posting-public can collectively build their own grassroots map. And their photos can be cast like votes that represent people in the places that bubble up to the map’s surface.
The column, In Public, is made possible with the support of the John S. and James L. Knight Foundation.

Eric Scharnhorst is a project manager at Gehl Architects in Copenhagen.