While Bay Area residents may have strong opinions about housing development, they often lack information about what exactly goes into a luxury condo tower or apartment high-rise. Now a new online tool from Terner Center for Housing Innovation at UC Berkeley allows everyone from residents to legislators to see how different local conditions and government policies impact the cost of housing development across the Bay Area, and to zoom in for detailed analysis of four cities, reports the San Francisco Business Times.
The Housing Development Dashboard, which went live last week, consists of two calculators. The first, the development calculator, shows how factors like affordable housing requirements, local rents and density limits affect the cost of development in the Bay Area, using those factors to predict the likelihood that a project will actually be built. The second calculator, the policy gauge, takes a closer look at how changes in certain government and market factors could impact housing development in San Francisco, Oakland, Menlo Park and Pleasanton.
When it comes to determining how likely it is that a project will be built, the dashboard breaks down the factors influencing new development into three categories: market factors, local government factors and other. Local rents are a market factor, as is landowners’ willingness to sell. In this model, the latter is calculated using the difference between what a developer is willing to pay for a piece of land and a landowner’s perception of its value based on what they’re seeing in the market. Target return, a measure of how likely investors are to get involved in a real estate project based on risk, is also a market factor.
Local government factors include height restrictions, parking minimums, basic permitting times, and requirements that developers include affordable housing in their project or pay a fee for the building of it elsewhere. While the graphs that show market factors’ effect on project likelihood swing sharply upward as rents climb, and sharply downward as projected investment returns diminish, the affordable housing requirement graphs are far less dramatic. Compared to the market forces they show much less of an impact on development in Terner’s dashboard. The affordability of those units does make a difference though. As the tool notes, requiring that 20 percent of housing be affordable to people making 50 percent of area median income makes a much larger difference than requiring 10 percent of housing be affordable to people making 120 percent of AMI.
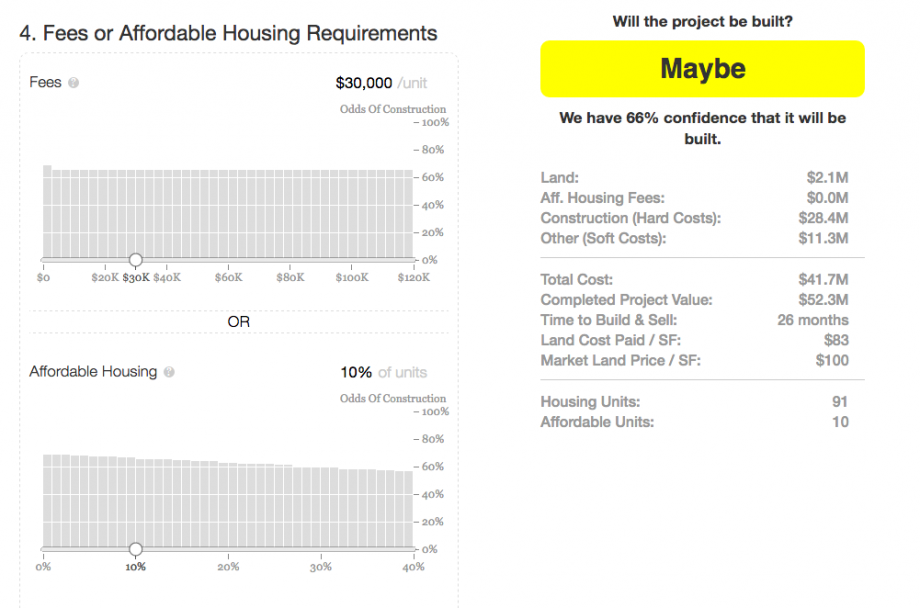
Factors in the “other” category include expected construction cost and rent increases, bank loan interest rates, average unit size, the percentage of the first floor dedicated to ground floor retail, and whether the project is in a landslide zone. With the Development Dashboard calculator, users are able to toggle all of these factors, and see a percentage likelihood that a project with these characteristics could be built.
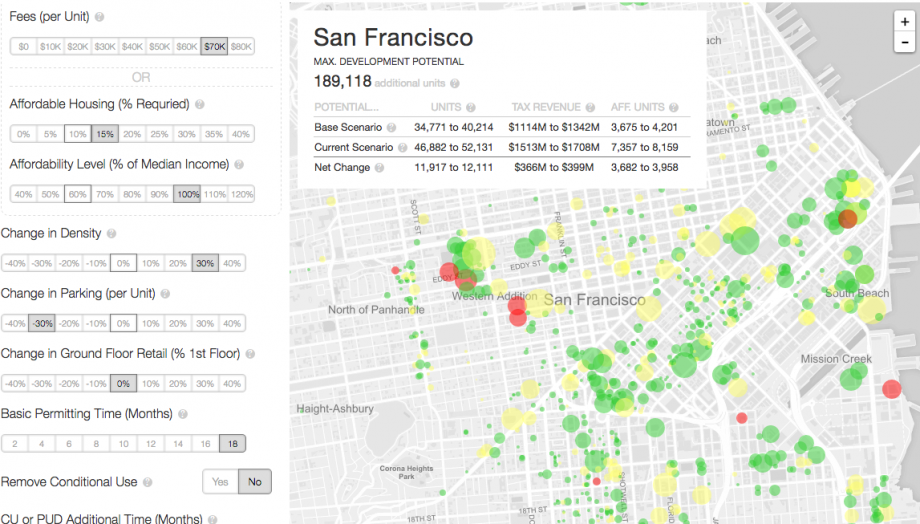
The policy gauge calculator takes a broader view, asking how much housing would be built at the city scale, given certain conditions. Users control similar factors and see the number of units likely to be created. Up the density, decrease the parking minimums, require fewer affordable units for households making a higher percentage of AMI and watch the number of units likely to be built in San Francisco, Oakland, Menlo Park or Pleasanton increase. The tool estimates that under current conditions, San Francisco could develop 40,214 new units, a maximum of 4,201 of which would be affordable. Users can up that number by 4,500 by decreasing the affordable housing requirement, but they’d lose more than 1,400 affordable units. In other words: It’s complicated.
The tool, which is still in beta, draws on a vast trove of data, detailed in the methodology section below the tool.
Jen Kinney is a freelance writer and documentary photographer. Her work has also appeared in Philadelphia Magazine, High Country News online, and the Anchorage Press. She is currently a student of radio production at the Salt Institute of Documentary Studies. See her work at jakinney.com.
Follow Jen .(JavaScript must be enabled to view this email address)