Like many older millennials, I grew up building with Legos on the floor of the living room while Tom Selleck sped around on the TV in a bright red Ferrari 308 GTS solving crimes of all types with a level of mustache-powered suave that remains unmatched to this day. Decades later—as an investigator of urban resiliency—I often find myself shamelessly channeling the wisdom of Thomas Magnum, P.I.
From flooding in Phnom Penh to a food shortage in Mozambique, our newsfeeds are continuously overflowing with incomplete fragments of urban narratives. Nearly instantaneous digital access to photojournalism and videography gives us real-time glimpses of “how it must feel” around the world—on the ground, in the moment, at the time.
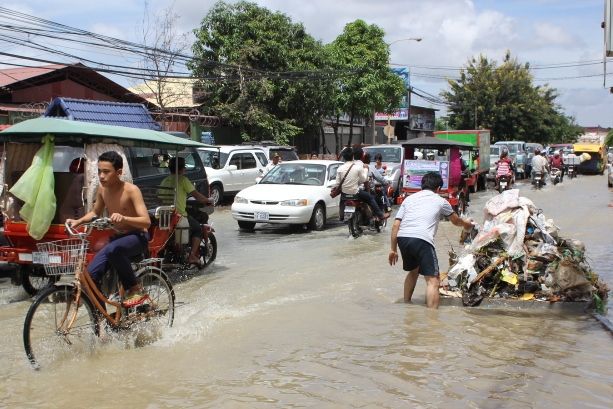
Flooding in Phnom Penh.
As an urban designer and resiliency analyst, I want to know more. What led up to this? Where did it come from? What could have been done proactively beforehand to lessen the negative impacts? All 1980’s mustache references aside, Magnum P.I. knew it just as well as I do: there is always a hot trail to be followed and you can’t catch up to anyone or anything of value without having the fastest car.
HOT PURSUITS: CHASING DOWN URBAN ISSUES
The urban situations we study often behave a bit like fugitives. They tend to show us false identities on the surface, and we have to go backstage with them for a while to truly understand them. In getting to know a city, we can only go so far with singular data. A value such as overall economic growth means very little until we overlay it onto other conditions like educational accessibility or public health indicators. As we approach cities with this type of systems thinking, we see that binary yes-or-no questions and answers have almost entirely lost their relevance.
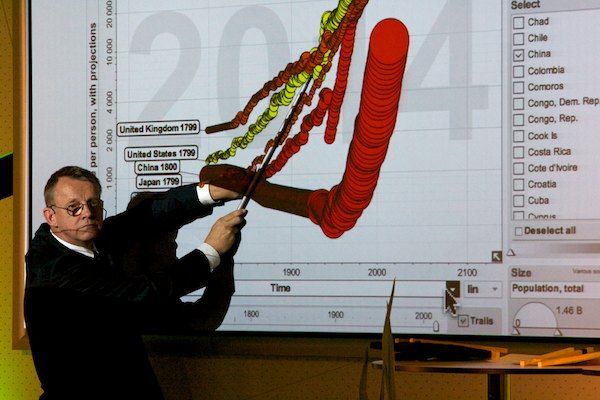
Swedish doctor and international health visionary Hans Rosling visualizing health data.
As our modes of questioning grow in complexity, the standard out-of-the-box MS Office visualizations are falling to the wayside. Even as flashy as Microsoft has tried to make them in recent years, the multi-colored bar graphs of yore simply cannot keep pace with the intensity of urban analytics in the network age. Like distant galaxies without the Hubble Space Telescope, the fleeting relationships at play in a city are simply not visible without powerful analytics and multi-layered data visualization tools.
UNDER THE HOOD WITH PROCESSING TECHNIQUES
For a number of years, digital artists and designers have been experimenting with processing techniques to transform these elusive data patterns into crystal clear visual communications—nuances and all. Their crime-fighting vehicle of choice? A fleet of liquid-cooled multi-core processors glowing with blue LED’s and humming away at multi-thread calculations somewhere in a distant data center.

A visualization of flight patterns by Aaron Koblin. Image courtesy of Aaron Koblin.
Aaron Koblin has focused his work in this realm of network data visualization. Manipulating datasets with millions of entries of various content types, he is finding fruitful ways to build bottom-up visualizations that can help us understand human and infrastructural networks in poetic and almost indescribable ways.
Through a comprehensive multi-scale animation, he shows us the real-time paths of nearly every flight in the world for 24 hours. The critical takeaway is not the binary fact that the FAA is monitoring 140 and some-odd thousand aircraft at any given time, but how the individual flight paths dance rhythmically in time around the world. We see blue paths diverging and converging around the world, perfectly matched with the daily human pulses of waking, sleeping, moving, and connecting. Zooming in to individual airports, Koblin shows us highly-specific holding patterns and adaptations in flight paths as air traffic densities and wind directions shift throughout the day.
GOOD DATA GENERATED THROUGH RECREATION
Similar data sets are showing up in the fitness apps world.
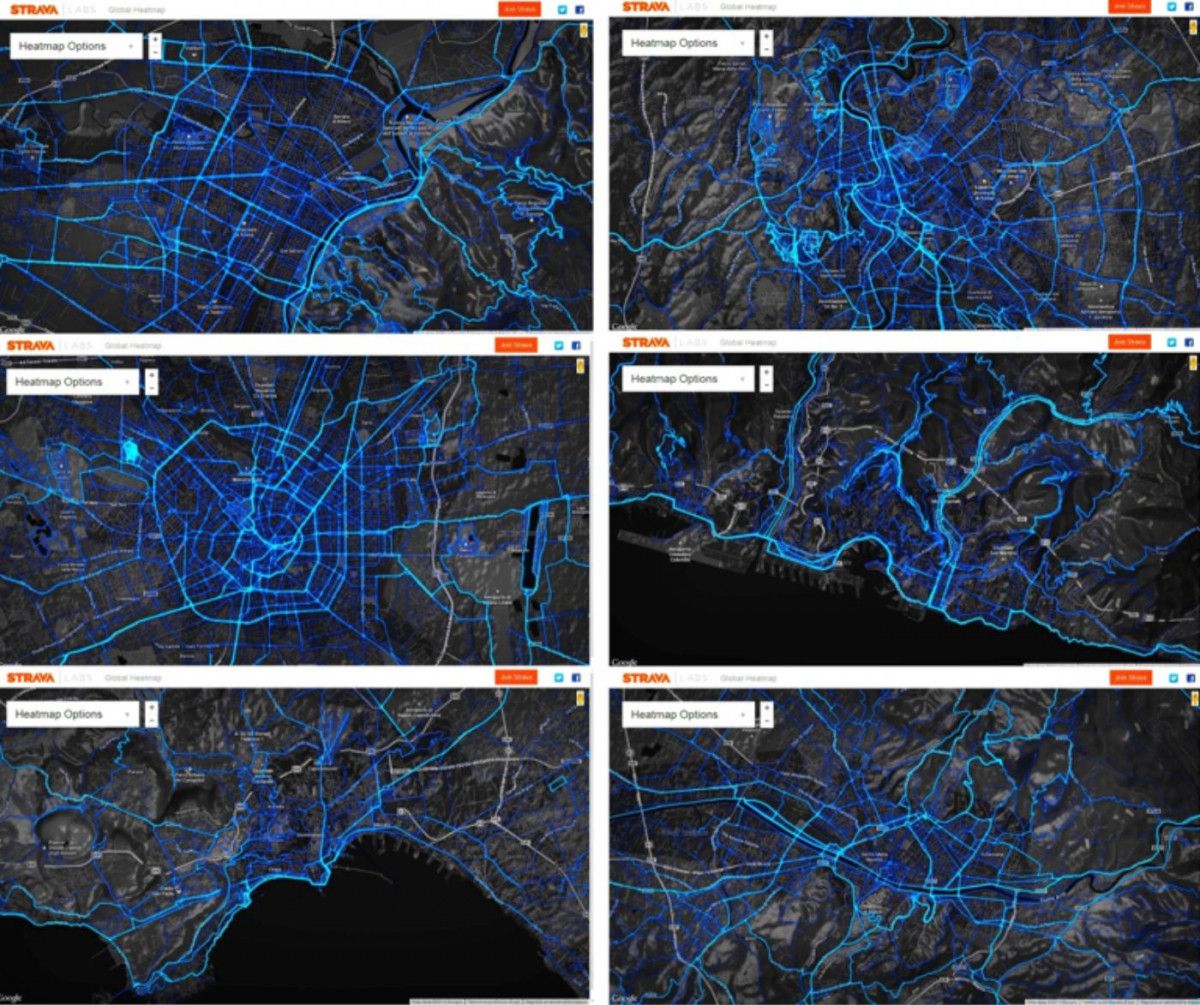
Heatmaps, Strava Labs
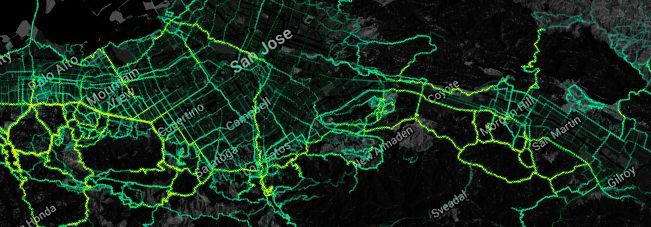
Platforms like Strava allow running and cycling enthusiasts to map, record and share their routes through GPS recording.
The overlay of these pathways in a city help us to assess its fitness (and vis-a-vis, its overall health) landscape. These highly-accurate heat maps show us both hot and cold physical exercise areas of the city over time. As urban designers, we can begin to take cues on specific locations which could benefit from fitness-related development to help bridge geographic gaps in the fitness network and bolster the overall health and well-being of the city.
Heatmap, courtesy of Richard Masoner / Cycleicious via Flickr CC
SYNTHESIS WITH ANIMATED INFORMATION
In other aspects of health, there are big issues that we can begin to attack more rigorously through data visualization. We’ve known for decades that Africa struggles with AIDS, but it is not enough to simply quantify the number of infected individuals. In urban resilience, we need to understand it in greater contextual nuance. We need to see the dynamics of the problem over time and in juxtaposition to other contributing and resultant factors like poverty, social/cultural views, public health education, etc.
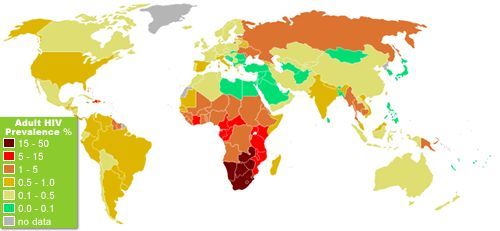
Map courtesy of Blatant World / Flickr CC
Hans Rosling is adopting animated blobs for contextualizing these urban health issues with a dynamism and clarity that we just can’t see through pages and pages of traditional stationary line graphs.
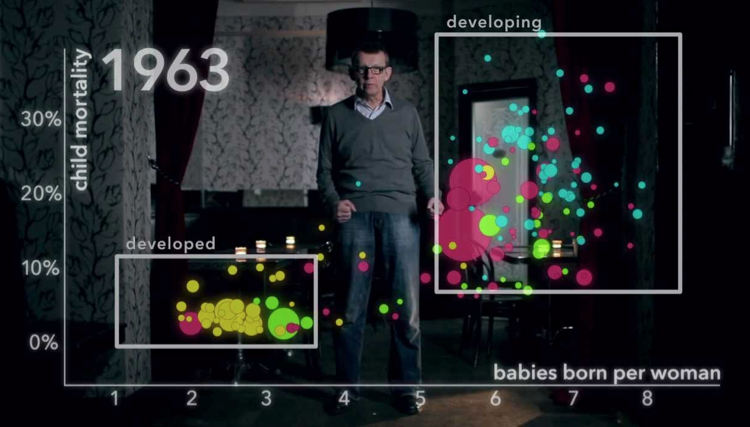
The River of Myths, Hans Rosling
His animated graphic nodes grow, shrink, and float freely through x and y coordinates, reflecting specific shifts in global health patterns throughout decades of changing cultural, political, infrastructural, and financial conditions. Through animation, Rosling’s blobs show us not just notable trends, but dynamic rates of change. He’s effectively using a calculus framework of visualization while everyone else is stuck in the static land of algebra.
RESILIENT SOLUTIONS 21
In our own work at Resilient Solutions 21, we’re developing similar traction by merging data sets which have historically been represented as their own autonomous figures. Traditionally, climatic indicators have been pigeon-holed into bar or line graphs with a separate graph for each layer of information—one for average high temperature, one for average low, one for humidity, and so on. Moving beyond this singular methodology, we are developing parametric tools which allow us to understand dynamic relationships between weather patterns and the ways cities actually operate every day.
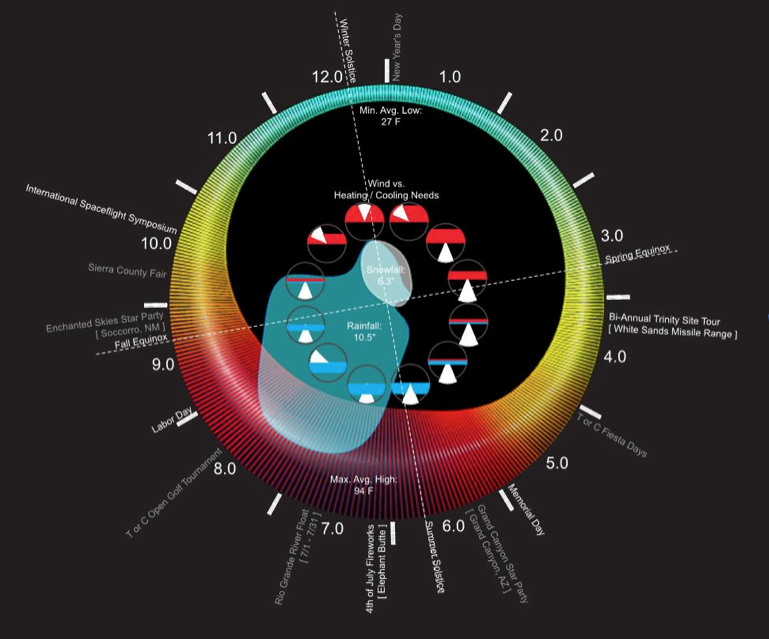
Anthropo-Climatic Diagram, Resilient Solutions 21
In the example above, we are displaying a wide range of factors which are all related to one another, but are rarely visualized in this way—together as a system. Temperature, precipitation, snowfall, length of day, wind patterns, and expected demand for heating/cooling systems are all displayed simultaneously. This layered format helps to quickly highlight primary correlations among data sets.
Then, by adding significant civic events to the weather calendar, we can start to look at additional relationships of how weather and culture are interacting and influencing one another within the city. Like a fingerprint, the anthropo-climatic signature of every place is unique.
These types of dynamic visualizations help us more clearly see the real idiosyncrasies that define a city and its true resilience characteristics.
LOOKING DOWN THE ROAD
It’s now been 27 years since Magnum P.I. turned in his badge, and the world is a vastly different place. In our systems approach to urban resilience, data visualization is more than a passive mechanism for communicating one-line statistics and simple geographies. As our tools develop increasingly robust capabilities, they are becoming active participants in analyzing, dissecting, and nimbly responding to otherwise inaccessible urban relationships. As a discipline, we are just getting started and there will be great wealth of innovation in the space in years to come. The bright red visualization Ferrari is in the garage, getting highly tricked out. Soon, it will be chasing down even the fastest of urban problems.
Brian is a resilience analyst and urban designer with nearly ten years of experience working on problems of architecture and resilience in Haiti, Korea, and across the U.S. He thrives on collaborative opportunities to engage complex urban situations with in-depth and synthetic research techniques. Resilient Solutions 21, or RS21, pulls from a wide array of disciplines to create solutions for cities, countries, agencies and businesses challenged by the physical, social and economic forces that will drive our world in the 21st century. For more information, contact charles@resilientsolutions21.com.


_1200_700_s_c1_600_350_80_s_c1.jpg)