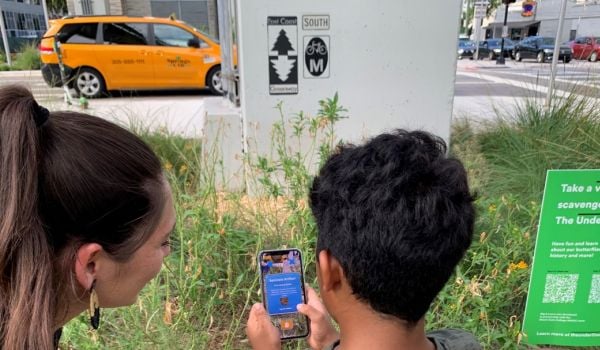
Today the average American makes more data before breakfast than George Washington did over the course of his entire life. Worldwide, we’re generating over 2.5 quintillion bytes of data every day, most of it from interacting with digital content like email and Facebook. But cities and the people using them are physical. Our understanding of how people interact with each other offline, in public spaces, and how these public spaces then impact communities is often a mystery.
The classic approach to collecting physical data about people in cities is to record how people use the public realm. Jan Gehl began collecting and using data to unravel this mystery in Copenhagen 45 years ago. Since then, city by city, street by street, the Gehl database has grown to capture the life of thousands of streets and public places. Now we can compare the life of a street in Sydney, Australia to one in Xalapa, Mexico. The approach has been fine-tuned over the years, and the scope has expanded incrementally every time we work in a new city.
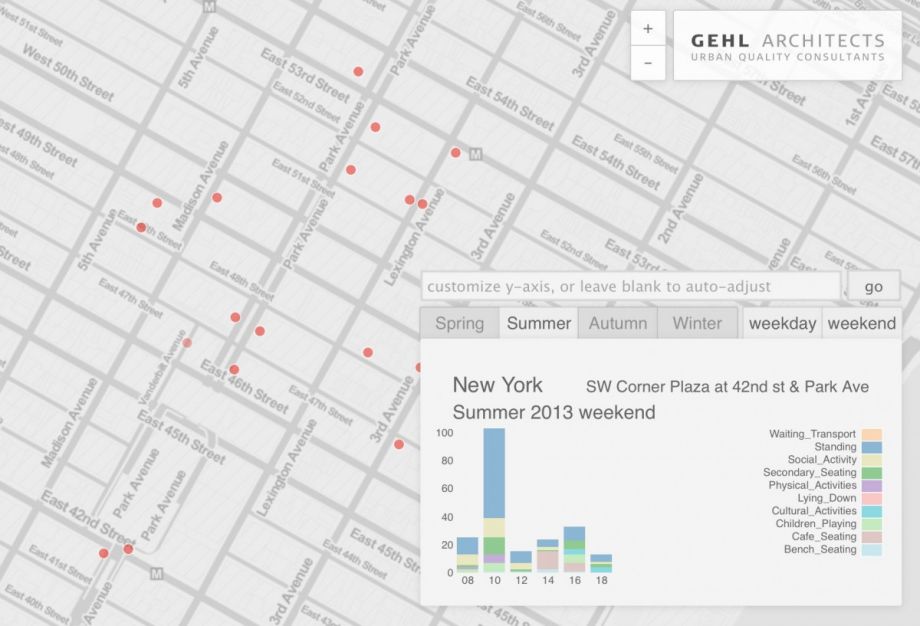
Our data at Gehl Architects is unique because of its human focus. In addition to hourly pedestrian counts, we record the number and diversity of stationary activities in the public realm. Stationary activity data is a good proxy for the public life of a place. A space dominated by people waiting for the bus has a different life than one with a balanced mixture of children playing, people standing, and people sitting and talking. We incorporate age and gender information to the stationary and pedestrian data to get a better sense of who is using a space.
This kind of data gives urbanists a platform to advocate for cities for people. We used some of this empirical data to champion the pedestrian and public space improvements along Broadway and throughout New York, throughout Melbourne’s network of alley ways and civic destinations, and other public realm improvements all over the world. The methodology also presents some opportunities and challenges to use empirical observations relevant to addressing a variety of urban problems, from inclusion and equity to sustainability and resilience.
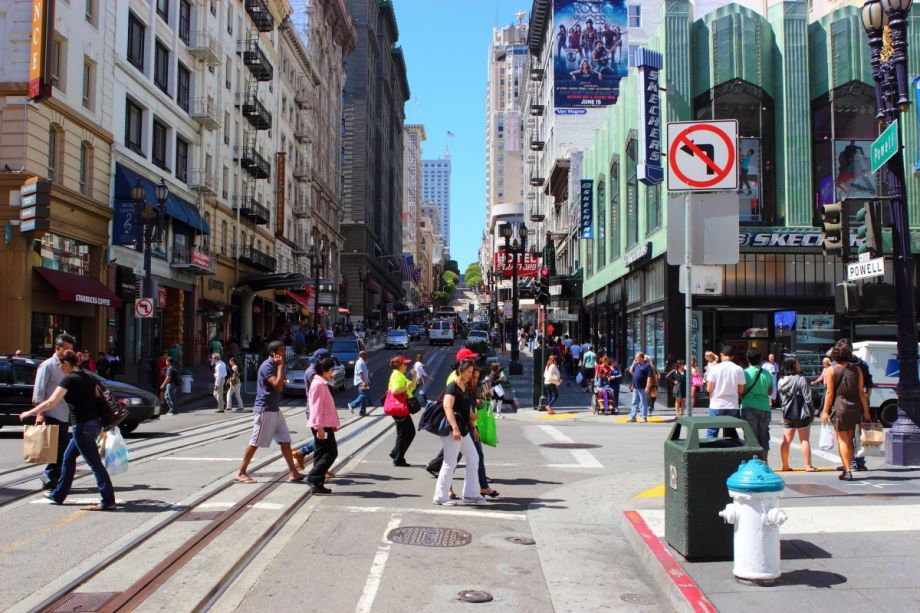
One such challenge is to understand the character of urban diversity in public space. Cities are celebrated for their heterogeneity, and piles of studies are written on the economic and social benefits of interacting with people different from you. Yet, our tools for understanding this heterogeneity are crude and often based on information separate from the people and their daily routines, which truly define a city’s character.
For example, take a look at a map of census data showing household incomes in New York. There is a concentration of wealth in the center, and a clear contrast north of Central Park. But is this representative of the social life of New York City? Of course not. Despite the clearly delineated income inequality on the map, New York’s public spaces are melting pots for the economic and social diversity of the entire city, and they are far more diverse than the blocks that surround them. You would never know that from looking at the map. How can we learn more about socioeconomic mixing at the human scale?
There are a number of new tools and datasets from governments, academia and industry that address socioeconomic mixing. In government, the US Census and the American Community Survey (ACS) are still the go-to sources. The ACS is now updated on a rolling basis, and the US Census is still on a 10-year refresh cycle. And although the resolution of Census data has improved incrementally every 10 years, the highest level of detail is the city block, and at that resolution only a limited set of attributes are available.
The ACS and the Census are both used by city planners to understand social and demographic trends. But the large grain size of the data means it can’t be used to zoom into a plaza to find out how people are spending time, or the quality of the experience on the ground. The Census will return values from a few years ago that characterized the socioeconomic characteristics of people living nearby. But asking the Census or the ACS what is happening at the human scale is like trying to find your favorite raindrop in a frozen pond.
Cities have been innovating and augmenting the Census and ACS data by opening up their own datasets. Open city data covers things like building and demolition permits, parking, food sources, car traffic and even the locations of rat sightings. This information can be used to map place and building characteristics — critical information for city planners. But everyday city life is rarely the focus. In these datasets, “people data” is usually limited to pedestrian injuries or worse.
Some new tools developed by hobbyists, industrialists and academics are leading the way in automating people data measurements. Different types of “smart” sensors now read license plates and count traffic, estimate pedestrian volumes by sensing the number of nearby WiFi devices and estimate stadium crowds by scanning for phones that have their Bluetooth sensors turned on. Tweets, photo locations, cellphone data and even taxicab data are mapped to learn more about what’s happening on the ground in cities. Video feeds of thermal imagery are used to count people walking and bicycling. Even arial drones outfitted with cameras and scanners feed their footage into software that generates detailed 3D models of city spaces.
But new types of traffic counters and more detailed 3D models are not providing new categories of information. These innovations are only doing old work more efficiently. And although they can make it easier collect more data, in doing so, they sometimes remove the stakeholder and volunteer data collectors who are most excited to contribute to the public discourse that follows the data collection and analysis phase. The innovations are not helping us understand how people interact with one another in the public realm. The reason cities don’t have this information is not because of technological limitations. It’s because of a shared resistance to doing the work in the first place. Although city planners map citywide Census-level socioeconomic categories like income and family size, they are hesitant to measure how people of different “categories” mix in the public realm.
The hesitation is justified. It comes from real concerns about potential political backlash. It is one thing to compare the median income of different neighborhoods. It’s quite another to compare the incomes of people sitting next to each other on a bench, and to try and understand how that affects their urban experience.
If this job isn’t getting done because it’s uncomfortable work, then waiting for a technology-based solution may take forever. The first step is to address the question of how the Gehl methodology can be adapted to collect socioeconomic data at the human scale. We will explore this question over the course of the next few months and will report back in an “In Public” post soon.
The column, In Public, is made possible with the support of the John S. and James L. Knight Foundation.

Eric Scharnhorst is a project manager at Gehl Architects in Copenhagen.