There are lists aplenty that advise readers on where to move for the “most affordable housing” or the “top 10 locales for high-paying jobs,” but as municipal govs share and adopt best economic development strategies, context matters. There’s value in stacking cities up against one another when it comes to how far wages go in a particular place — and how policy plays a role in that formula.
The Tax Foundation used data from the Bureau of Economic Analysis to create a map of purchasing power that drilled down into regions across the U.S. It found that while living in a city (as opposed to a rural area) definitely makes a difference, it also matters which state that city is in.
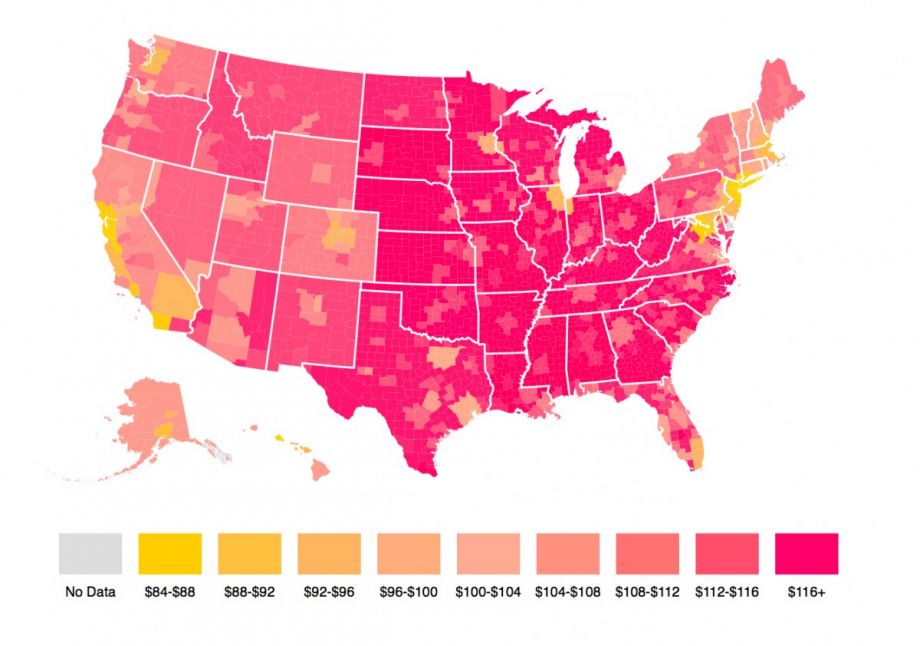
(Credit: Tax Foundation)
According to the Tax Foundation:
It’s important to note that price differences do persist across states, even in non-metropolitan areas. $100 still doesn’t go nearly as far in rural California ($102.56) as it does in rural Texas ($114.03). It doesn’t even go as far as it does in San Antonio ($106.27). This suggests that policy — not just geography and urbanization — may play a role in these price differences.
According to BEA numbers, here’s how much you need to buy a nationally averaged $100 worth of goods and services in the five “most expensive” and five “least expensive” U.S. metros. The least expensive metropolitan area, has a $44.5 advantage on the most expensive metropolitan area.
5 Metropolitan Areas With the Highest Regional Price Parities
1. Urban Honolulu, Hawaii (122.5)
2. New York-Newark-Jersey City, NY-NJ-PA (122.3)
3. San Jose-Sunnyvale-Santa Clara, California (121.3)
4. Bridgeport-Stamford-Norwalk, Connecticut (120.8)
5. Santa Cruz-Watsonville, California (120.5)
San Francisco-Oakland-Hayward, California, came in at No. 6 with a RPP of 120.3.
5 Metropolitan Areas With the Lowest Regional Price Parities
1. Beckley, West Virginia (78.0)
2. Danville, Illinois (79.2)
3. Rome, Georgia (81.3)
4. Jonesboro, Arkansas (81.7)
5. Valdosta, Georgia (81.8)
Jenn Stanley is a freelance journalist, essayist and independent producer living in Chicago. She has an M.S. from the Medill School of Journalism at Northwestern University.
Follow Jenn .(JavaScript must be enabled to view this email address)