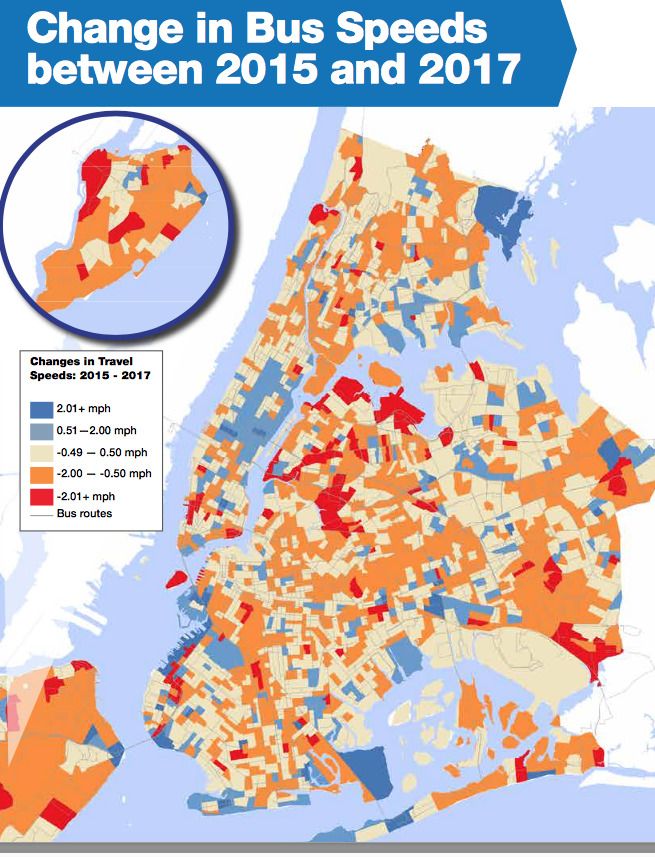
New York City’s department of transportation released its first Mobility Report since 2016, “and the topline numbers scream for congestion pricing,” Streetsblog NYC writes.
Indeed, the data show that average car and bus speeds have fallen, with the average city bus poking along at 7.44 miles an hour in 2017. Most buses have gotten slower since 2015, the report said.
To blame? Traffic, likely from the uptick in ride-hailing services like Uber and an increase in personal vehicle purchases. The report didn’t explicitly lay the blame on Uber and its ilk for increased congestion, but noted that the city saw 92.5 million trips in 2016, an all-time high. The city has added 44,000 for-hire vehicle registrations — which includes taxis, black cars, green cabs and private cab companies — since 2010, and household vehicle registrations are up 8.3 percent since 2010, leading to a small increase in per-capita car ownership. The report also noted that the city population has increased 4 percent since 2010 and continues to rise, another factor propelling travel demand. Overall, New York remains a car-light city, but the growth pattern “is in contrast to [the city’s] previous period of [population] growth, when per-capita car ownership actually declined as the population increased.”
New this year is a Citywide Mobility Survey administered online and by phone to thousands of New Yorkers across all five boroughs, the report said. The 40-question survey will be repeated annually to allow the DOT to track individual mobility choices and how they change from year to year.
The survey turned up some interesting data:
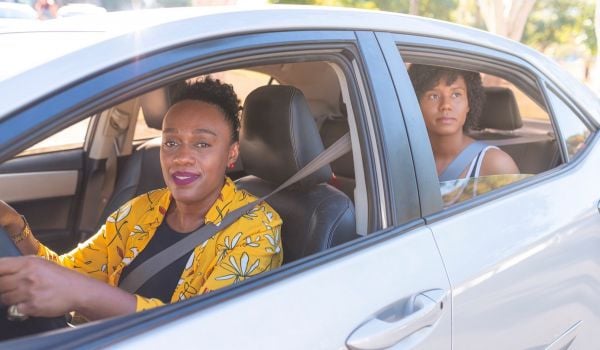
More than a third (35 percent) of New Yorkers use ride-hailing services, and a full half of people who do use ride-share say that it’s replacing transit (versus walking, driving a private vehicle or taking a taxi). Survey respondents are also low users of car-sharing services, such as Zipcar or car2go; only 8 percent of respondents said they had a membership in one of those services. Overall, the city still gets around overwhelmingly by private vehicle, walking, or taking the subway, with the number of trips taken by those modes clocking in at 32, 28 and 23 percent, respectively. For residents of all boroughs except Staten Island, more than half of trips taken are through “sustainable modes”: walking, biking, or transit.
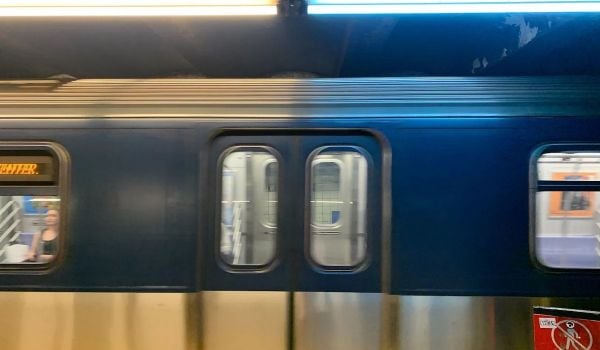
The report also looked at the effects of the Second Avenue subway on travel in the area since its launch in early 2017. Notably, yellow-cab trips dropped precipitously on the Upper East Side (36 percent since 2015), and ride-hail pickups increased more slowly there than they did citywide. Auto traffic speeds increased as well, the DOT reported.
Department of Transportation Commissioner Polly Trottenberg told WCBS Newsradio that “the trends we’re seeing tell us how much we have to keep innovating and experimenting to keep the city moving.”

Rachel Kaufman is Next City's senior editor, responsible for our daily journalism. She was a longtime Next City freelance writer and editor before coming on staff full-time. She has covered transportation, sustainability, science and tech. Her writing has appeared in Inc., National Geographic News, Scientific American and other outlets.
Follow Rachel .(JavaScript must be enabled to view this email address)