New York City has a new way to examine inequality, with a year-to-year comparison. How far back are some people left behind? How much is the playing field skewed? How different is the journey for a person of color to relative economic self-determination? And on top of all that, is it getting better or worse? The answer seems to be: It depends.
The CUNY Institute for State and Local Governance (ISLG) today released its second annual NYC Equality Indicators Report. With last year’s research as a baseline, this year reveals how things are getting better or worse, or staying the same. “When looking at the city as a whole, little has changed,” the report reads. But that doesn’t mean nothing has changed.
“The overall score is so flat because a lot of changes are canceling each other out,” says ISLG’s Victoria Lawson, a co-author of the report.
The report looks at 96 total indicators, grouping them into 24 topics and six themes: economy, education, health, housing, justice and services. On three themes, inequality increased from last year: economy, education and justice. Inequality in the economy was the biggest increase.
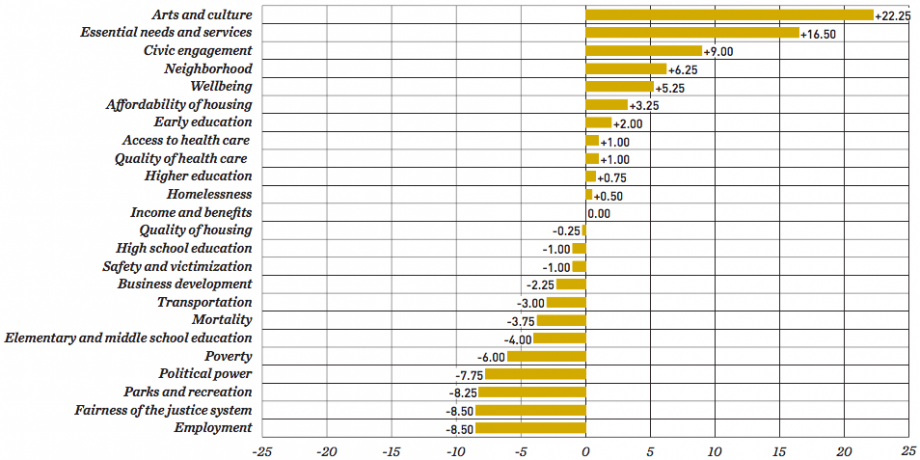
A graph showing progress (or digression) on the 24 topic areas covered by the 2016 NYC Equality Indicators Report (Credit: ISLG)
“There’s so much talk about how employment is going up [in NYC], but it’s not necessarily increasing for everyone equally,” says Lawson.
The city in fact reached record levels of employment this year, with an estimated 4.3 million jobs, an all-time high. But within the indicator topics, employment inequality was tied for the largest increase from last year.
“We saw a big increase in inequality for people with disabilities,” says Lawson. “That was definitely a red flag.”
The report points to the city’s Wellness, Comprehensive Assessment, Rehabilitation, and Employment (WeCARE) program, but it also notes that the increasing unemployment rates among people with disabilities suggests the need for more targeted supports and programs.
The biggest inequality decrease posted? Arts and culture. Lawson says one of the big drivers of that decrease was a city program that places artists at senior centers, suggesting targeted programming can help. The number of artist residencies more than doubled in 2016, and location-based disparities were eliminated. In other words, layering newer services onto already existing resources and gathering places makes sense.
Sometimes no change in inequality is worth flagging. Take the ISLG’s look at race and post-college-degree employment. To measure this in terms of inequality, the authors use the ratio between percentages of recent black and white graduates who are unemployed. This year, same as last year, recent black college graduates are 2.5 times as likely to be unemployed than recent white college graduates. As much as the city can do to target scarce public resources toward populations that are clearly facing additional barriers, Lawson points out that all of this can’t be pinned on City Hall.“Employment is one of those areas where clearly the city has a role to play but obviously there’s just general discrimination and racism,” she says.
That said, city agencies are the primary audience for the report, as it’s meant to guide them to deploy resources more efficiently to address the most gaping disparities first. Between last year and this year, ISLG remained in dialogue with agencies to help refine and improve indicators. “They know their data and what’s behind it better than anyone else. In some cases it wasn’t quite getting at what we were trying to get at,” says Lawson.
Lawson points out one example on health. Last year, the report measured immigration status and tuberculosis (TB) rates as one of the inequality indicators. The city’s Department of Health and Mental Hygiene (DOHMH) pointed out that many immigrants come from countries where tuberculosis rates are much higher, and, knowing that, DOHMH was specifically targeting certain communities to provide TB education and treatment; so a high posted rate of TB cases among immigrant communities wasn’t necessarily indicative of things gone wrong — that might have actually meant things were going right and being accurately accounted for. This year, ISLG replaced the immigrant TB indicator with a look at the relationship between income and chronic hepatitis B, which is one of the most common communicable diseases in NYC.
Overall, ISLG replaced eight indicators from last year’s report, and also changed data sources or definitions for another 11 indicators. “If an agency was unhappy that didn’t automatically mean we would change it, but if it was misleading, yeah,” says Lawson.
Besides talking to city agencies, ISLG also conducts a public survey specifically to inform the Equality Indicators report. They ask respondents to describe in a few words what they believe to be the number one inequality issue facing New Yorkers today.
Almost 1 in 4 respondents (23.2 percent) cited economic or income inequality, an increase from last year (14.6 percent). Those citing racism/racial inequality also increased, to 16.6 percent, compared to 9 percent last year. Housing and homelessness was a concern for 14.8 percent of participants this year, which was similar to last year.
ISLG also listed six inequality issues facing New Yorkers and asked respondents to rank them in order of priority. Topping the list: housing/affordable housing, income inequality/unemployment, and racial inequality or racism, with almost 1 in 3 respondents (29.5 percent) citing “housing/affordable housing” as their number one concern.
The Equity Factor is made possible with the support of the Surdna Foundation.

Oscar is Next City's senior economic justice correspondent. He previously served as Next City’s editor from 2018-2019, and was a Next City Equitable Cities Fellow from 2015-2016. Since 2011, Oscar has covered community development finance, community banking, impact investing, economic development, housing and more for media outlets such as Shelterforce, B Magazine, Impact Alpha and Fast Company.
Follow Oscar .(JavaScript must be enabled to view this email address)