As unpredictable as Donald Trump has been — first as candidate and now as president — he has espoused fairly orthodox Republican positions on financial regulation. Namely, he sees the banking sector as awash in a sea of over-regulation, and his preference that such regulations be streamlined if not eliminated.
For many people, the aftermath of the recent economic recession — in which over-leveraged and under-scrutinized banks contributed to a near-collapse of the global economy — is all too real. It created havoc in communities across the country and strengthened the case for regulations. This crisis led to many actions out of Washington, including the passing of the Dodd-Frank Wall Street Reform and Consumer Protection Act (Dodd-Frank) and the creation of the Consumer Financial Protection Bureau (CFPB). These are two key components of our current approach to regulating the banking industry and protecting banking customers that President Trump now wants to significantly reform or dismantle. If this wish comes true, impacts could range from less bank transparency and less protection for customers to the return of shadow banking practices and more financial instability, all outcomes that could be detrimental to cities.
For us data geeks, there is another loss associated with the demise of Dodd Frank: access to information. The 2010 law included provisions that would have required banks to publicly disclose more information about lending practices, a requirement that would help government regulators better see how particular communities are being affected by our financial systems.
There is evidence that having data like this out in the world matters.
Advocacy efforts in the 1960’s and 1970’s led to the passing of the Home Mortgage Disclosure Act (HMDA) in 1975 and the Community Reinvestment Act (CRA) in 1977. The HMDA mandated that banks make lending activity data publicly available on an annual basis, providing the public with a rich data set that can be used to understand where capital access metrics such as home loan penetration, denial rate, and subprime levels may vary by geography.
Meanwhile, the CRA required that banks be subject to an evaluation of their performance in providing credit throughout the communities in which they are chartered, enabling CRA ratings that give us a sense of how banks are doing at investing in all communities, including and especially low-income communities and communities of color.
Together, these two regulations created a framework for communities to measure how banks were serving them; a structure for accountability.
These data points are increasingly entering the public consciousness and factoring into local policy and community advocacy efforts. For instance, more than 20 cities have or are contemplating “responsible banking ordinances” (RBOs), which hold banks in their jurisdiction accountable to some form of regular reporting of home lending, business lending, and branch location decisions.
In the city of Philadelphia, banks that are authorized to hold deposits for city government have been subject to an annual analysis of their performance for the past 10 years. Econsult Solutions, Inc. (ESI), where I am an a senior vice president and principal, and MFR Consultants have performed this analysis every year, each time relying solely on publicly available data and on an annual survey that participating banks are obligated to complete in response to the previous year’s analysis. In other words, the analytical effort is minimally invasive to the banks and yet yields a significant amount of information on the state of banking in neighborhoods throughout the city.
Building from its familiarity with these data sets and with this topic, ESI recently completed a national banking analysis and created an interactive map enabling users to see key lending metrics in 25 cities across the U.S. The data sources used in this analysis are all publicly available, including the 2014 American Community Survey, 2015 HMDA, and the Federal Financial Institutions Examination Council (FFIEC). The analysis and mapping of the key lending metrics illustrate imbalances between lower-income and upper-income neighborhoods, and between communities of color and other communities (see map below). While insufficient information prevents us from drawing conclusions too quickly, the map reveals significant disparities in banking practices.
When mapped, one can see that home loan penetration is the lowest in predominantly minority neighborhoods of the Northeast and Midwest. Analysis shows, for example, that even though racial and ethnic minorities make up about 50 percent of Buffalo and Dayton’s households, they only receive one out of four home loans. In Kansas City, minorities represent more than 40 percent of the population but there are five times as many home loans granted in non-minority areas as in minority-areas. This disproportion toward loan applicants in predominantly minority neighborhoods raises questions, but further analysis would be necessary to prove actual discrimination. Although banks are barred from “redlining” — denying mortgage to residents of certain areas based on the racial or ethnic composition of those areas — anecdotal evidence may suggest that the practice persists. The data available today is insufficient to show bias. If Dodd-Frank lives on to see its reporting provisions phased in, the new data may yield a more accurate parsing of when disparities can be explained by systemic differences in borrower characteristics, or when they are evidence of discrimination.
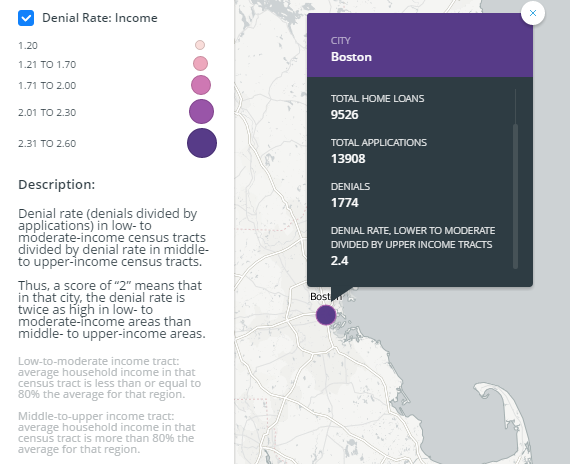
Another phenomenon made visible on our map is a disparity in mortgage application denial rates. Many more people in minority and low- to moderate-income neighborhoods of cities of the East Coast and Midwest are denied mortgages than in other parts of the country. In Boston, for example, a large segment of its population is unable to access credit. The denial rate there is more than twice as high in low- to moderate-income areas as in middle- to upper-income areas, and this multiple gets even higher (2.4) when it comes to measuring the denial rate in minority areas against non-minority areas. That disparity has continued even in the wake of RBO ordinance — the “Invest in Boston” ordinance unanimously passed by the Boston City Council in 2013. Similar trends can be observed in Washington, D.C., Chicago and Kansas City.
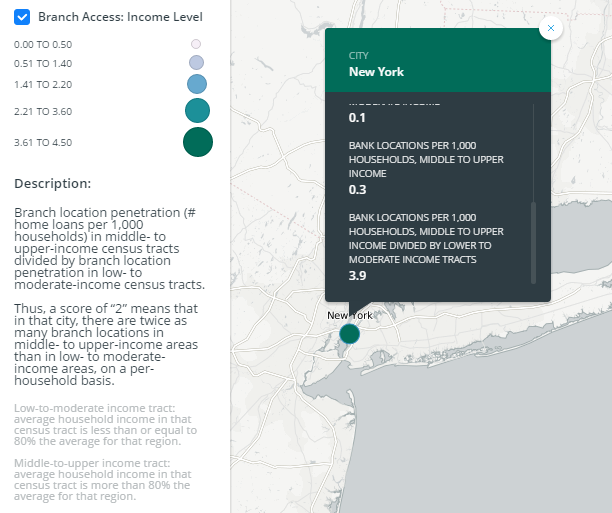
A third metric featured on this map, bank branch access, underscores the gap between the services provided to middle- to upper-income neighborhoods and those available in low- to moderate-income neighborhoods. For instance, the large sections of New York City that remain underserved by banks are those with low- to moderate-income populations. With fewer banks, these residents have little access to banking services and products, and are less likely to be able to build a credit history necessary to secure a mortgage.
As we enter the era of President Trump, what will happen with banking remains to be seen, given the difficult trade-off between the pressing need for oversight and the potentially counter-productive effect of over-regulation. But whatever happens next should yield more information about bank activity. Only with more information, not less, can we transparently hold banks accountable on issues of capital access. When debating policy matters, we can have our ideological differences of opinion, and hopefully we can do so respectfully and constructively, especially on something as important as financial regulation. But it is undeniable that we all benefit when the right information is made available in a transparent and objective manner. That’s something that we all — banks, advocacy groups and participants on both sides of the aisle should be able to agree on.
Lee Huang is Senior Vice President and Principal at Econsult Solutions, Inc. Huang has consulted on several banking-related projects and has advised clients on fair lending issues for many years.