Urban leaders have long speculated about the size and growth of the so-called “sharing” or “gig” economy, but reliable data have been hard to find. The rise of the online talent platforms raises tough definitional issues, for one thing. Moreover, government data gathering on the sector remains insufficient and outdated, in part because the government stopped measuring “contingent work” arrangements after 2005. (A revamped survey won’t get into the field until next year).
Which is why the Metropolitan Policy Program at Brookings released a new analysis of the “gig economy” that applies some new numbers to the spreading use of online platforms to link freelance workers to customers, with a particular focus on the ride- and room-sharing industries dominated by Uber and Airbnb.
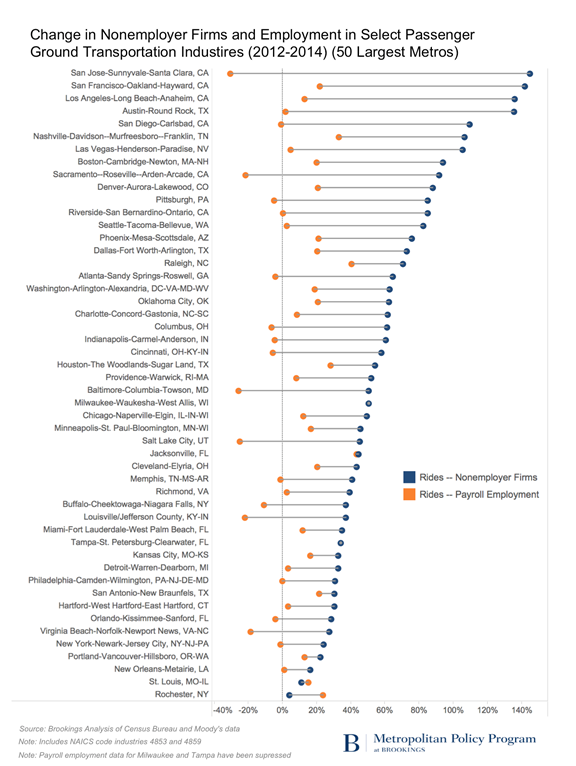
What do the numbers say? Overall, our estimates of the rise of freelancers’ “non-employer firms” in the largest 50 metropolitan areas confirms that the growth of this activity in recent years has been explosive in many, though not all, metropolitan areas. In San Jose, the number of “non-employer firms” in the rides industry spiked by a whopping 145 percent to more than 3,000 independent contractors between 2012 and 2014. In Nashville, the number of drivers using ride-hailing apps doubled. And in Austin, the two-year growth of “room-sharing” was 48 percent. Along these lines, my favorite chart from the report (focusing on the rides industry) shows that the gig economy is, at least in two industries, measurable, significant and growing fast.
Clearly these numbers raise huge issues about the evolving world of work and whether the app-based freelancing represents a handy complement to more conventional payroll employment or a major challenge to it. More data will be needed to answer that question.
But while it’s great some basic statistics on the table, it’s also worth thinking about the patterns they reveal — and what those patterns say about the economy and urban life.
And here, I want to focus on the interesting ways that the new data speak to how change rolls through the U.S. city network — something the economist Joe Cortright discusses in a post at City Observatory. In this regards, the introduction and adoption of ride- and room-sharing through online platforms in the years after 2008 provides a concrete vignette of how a new technology, business-model and social innovation launches, gets adopted and then spreads.
To be sure, the spread of ride-sharing across the urban map involves more than viral adoption. Corporate launch schedules and local regulatory decisions are also shaping the rollout.
Still, a scan down the 2012–2014 growth chart, from the fastest growers toward slower growers, amounts to a “blink” survey of how a new idea diffuses through the metro hierarchy, managed by corporate priorities, reflecting local receptivity and impeded or abetted by local regulatory politics. Such a scan shows that ride-sharing — once introduced by Uber’s 2010 launch in San Francisco — took off explosively once it was introduced in California early-adopter metros like San Jose, Los Angeles and San Diego; grew rapidly in fast-follower metros like Boston, Denver and Seattle; and has then been growing steadily in Midwestern “Main Street” metros like Dallas, Minneapolis, Columbus and Indianapolis.
Or look at it the way Cortright did. By ranking metros’ on their concentrations of gigging drivers in ride-sharing as a share of the regional population in 2014, Cortright constructs a kind of index of metros’ receptivity to “new ideas” in urban transportation. His results (displayed below) suggest that big, dense transit-rich metros like New York, San Francisco, Washington, Boston and Chicago have proven to be the most enthusiastic adopters of the new transportation model. Uptake has been far shallower to date in spread-out metros like Raleigh, Tampa and Oklahoma City. Which makes sense: Dense mega-cities are precisely the locations where the promise of crowd-based capitalism seems most relevant. Just as big-city economies are inherently about sharing infrastructure and space, so may big-city populations be intrinsically better suited to adopt digitally mediated gigging.
Whatever one’s particular perspective or theory, though, Metro’s new gig economy data underscore the value of having city-by-city local data for tracking both new and longstanding trends of all kinds. It remains a problem that we don’t have more and better data on the gig economy, in all its manifestations. Having such data will help us better understand cities and, in this case, how new ideas roll through them.
Mark Muro is a senior fellow at the Brookings Institution’s Metropolitan Policy Program. His work focuses on how innovation shapes cities, and cities shape innovation.