For Governing magazine, John Buntin tells the really quite interesting story of how the Chicago Police Department is, of late, attempting to study the social ties of those involved in gang violence to gain a predictive capacity it has heretofore lacked. Here’s Buntin:
We live in an age of social media, where companies such as Facebook and LinkedIn assiduously map our friendships and use that knowledge to shape our preferences and behavior. Today, the Chicago Police Department is doing something similar with gangs. Using a tool academics call “network analysis,” the CPD is mapping the relationships among Chicago’s 14,000 most active gang members. It’s also ranking how likely those people are to be involved in a homicide, either as victims or offenders. In the process, the CPD has discovered something striking: Cities don’t so much have “hot spots” as “hot people.” That finding is transforming the way the police do business in Chicago and has significant implications for how other cities should be policed.
It’s a great read, and well worth the effort, but one thing worth poking at is the idea that cities don’t have “hot spots” where crime is concentrated. Chicago certainly has a bad gang violence problem, which tends to be closely bound up in social relationships. But the idea of location-based policing has really only gotten more traction in recent years, with the caveat that what seems to matter are very, very small locations — the literature calls them “micro-places.”
A storefront. A single townhouse. One short block. As researchers dive into the available data, they find that crime reliably happens in the same precise places, again and again.
One oft-cited study looked at incidents of crime involving juveniles in Seattle over a 14-year period, from 1989 through 2002. Using single, two-sided stretches of city blocks as their unit of measure, the researchers found that “fifty percent of all juvenile crime incidents occurred at less than 1 percent of street segments.” Moreover, “all,” all, “juvenile crime incidents occurred at less than 5 percent of street segment.”
When we’re talking about kids as perpetrators, that’s perhaps not so surprising. Kids tend to stick to the same few places: School, the mall, perhaps a park. But the pattern has held elsewhere. Take Lincoln, Neb., where this summer former police chief-turned-Director of Public Safety Tom Casady decided to see if the methods used in the Seattle study could reveal anything about his own city:
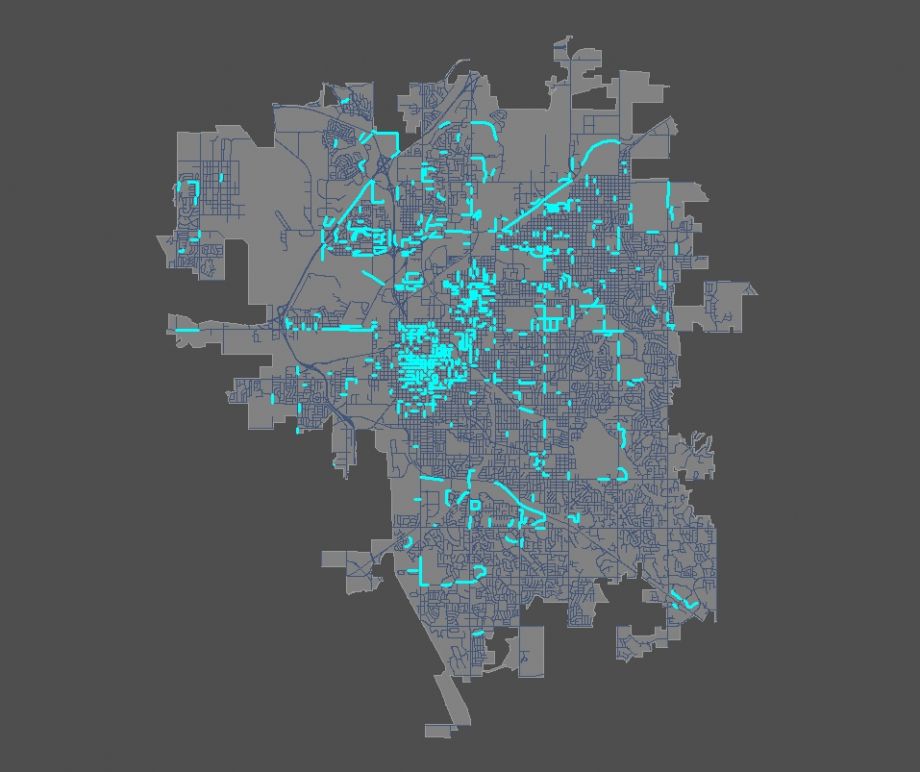
I’ve been meaning to look at this in Lincoln for some time, and I got motivated yesterday to do so, a job that took about 15 minutes to set in motion, and ran on my computer while I was away at lunch. Here’s my method: I took all the crimes reported to LPD in 2012 (21,153 total), and joined those points to the nearest street segment. Street segments in our geographic information system are essentially the equivalent of the block faces studied by Dr. Weisburd, et al. in Seattle. I then summarized the crimes by street segment, and joined the results back into the streets layer. My result was a GIS layer of streets, where each segment also has a COUNT field that is the sum of the 2012 crimes along that segment.
The result is the map up top. In words:
There were 13,771 total street segments in the City of Lincoln. Of those, 7,481 (54%) had no crime at all in 2012. Moreover, 81% of all the crime (14,149 offenses) occurred on only 5% of the street segments (689 segments). The top 1% of the street segments (138 segments) accounted for 7,148 crimes—41% of the total.
I was intrigued that such a data-intense job, as Casady put it, “took about 15 minutes to set in motion.” So I rang him up to ask how that was possible.
“I don’t think that there are a lot of departments that can do that,” he said. “We geocode our data several times a day.” On that day, a meeting had been canceled, and he had a few minutes to spare. It was fairly straightforward to run the data through the mapping software ArcGIS.
“It’s real easy for us to keep track of places where we have repeats,” Casady said. “The database does the work for you. You say, ‘I want to know, where have been dispatched on a criminal incident more than three times in the past 30 days,’ and the database provides you that information.”
Casady said that the “real tight concentration” didn’t exactly surprise him, but, “I was a little surprised how clustered it was. It’s an individual apartment within a 12-plex. It’s a single house on a street with nine residences.”
Refined placed-based knowledge, Casady said, is something a good cop on the beat has largely collected through experience. Yet data stored in an officer’s head generally stays there, which is why we circle back to the Governing story on Chicago’s network-aware approach. It’s based in large part on the work of Yale sociologist Andrew Papachristos, whose research has suggested that when it comes to figuring out who will commit violence, what matters is a combination of ties formed through past violent acts — you killed a member of my gang, I kill a member of yours — and geography.
There, though, sociologists run into trouble. In a paper called “The Corner and the Crew: The Influence of Geography and Social Networks on Gang Violence,” Papachristos and his co-authors write about limitations to the available geographic data. Research suggests that violence tends to occur between gangs whose turfs butt up against one another. But gangs don’t file details on their favorite haunts with the city. It’s up to police to sketch out which gang dominates where, and that approach tends to gloss over the fact that there are places within gang “boundaries” that are more significant — a favorite playground, a preferred stoop — and those potentially more fraught:
Our measurement of turf adjacency is not without its limitations. Gangs do not actually occupy the entirety of such turf polygons, but rather micro-locations within them, such as basketball courts and particular residences. Polygons such as those in more accurately represent the locus of a group’s control as perceived by the police and, as such, most likely include several smaller gang spaces. Unfortunately, we were unable to gain access to data at a smaller geographic unit and were therefore prohibited from generating more precise estimates of spatial distances between gangs.
Policing tends to fixate on “bad guys,” Casady said, but locations are, literally and figuratively, “where the action is.” Part of the challenge, then, is getting police to think of what they know about the points on the map where crimes occur as valuable information.
Along those lines, researchers at George Mason University’s Center for Evidence-Based Crime Policy are experimenting with a strategy they call “Case of Places”: A case folder like the one traditionally filed with the details of criminal incidents, but where the “suspect” might be a place, and “witnesses” might include whatever surveillance cameras are around. The goal is to “mak[e] procedures (and rewards) similar to those of traditional investigative work, but with a different unit of investigation.” Here’s a sample.

Nancy Scola is a Washington, DC-based journalist whose work tends to focus on the intersections of technology, politics, and public policy. Shortly after returning from Havana she started as a tech reporter at POLITICO.