They are the foot soldiers of academia, deployed to witness and record urban features, like trees or broken windows, that go unmeasured in traditional surveys. Over the past two decades, their clipboard reports have been the foundation for a great deal of sociological research on urban neighborhoods.
Several types of walkability audits, for example, were developed over the course of the early 2000s to evaluate how friendly a neighborhood is to pedestrians. In a typical study, 12 undergraduates covered over 70 miles of street and pedestrian pathway to answer 40 questions about walkability in College Park, Maryland.
Such efforts may soon be unnecessary. Instead of hiring, training and sending a team of “raters” into the city, Michael Bader, a professor of sociology at American University in Washington, D.C., is conducting fieldwork from a computer lab. Using an app he and his colleagues developed called CANVAS (Computer Assisted Neighborhood Visual Assessment System), Bader’s raters use Google Street View to tally curb cuts, crosswalks and graffiti in and around the District.
The resulting heat map of “disorder” features will be overlaid with health data about the elderly to tease out correlations between residents’ well-being and the physical state of the city. As urban populations age in place, this has become a hot topic for city governments.
In a way, Bader’s method recalls one that the sociologists Robert Sampson and Stephen Raudenbush used in a famous 1999 study of disorder in Chicago. Those scholars created their own primitive version of Street View by driving videographers around 23,000 blocks of Chicago at five miles per hour. It was a groundbreaking idea that led to several influential findings — but it wasn’t easily replicable.
CANVAS, Bader says, could revolutionize both the scope and speed of his colleagues’ inquiries. In sociology, the method is the message, and the efficiency of a data collection technique could greatly expand the boundaries of research — and our understanding of cities.
Why? Because the biggest expense in such research is labor. A researcher’s ability to pay for many hours of fieldwork limits the scope of his or her findings. Bader estimates that by keeping raters in the lab, he can cover almost four times as much territory on the same budget.
Bader’s kind of digital fieldwork frees researchers from their geographic shackles. “In sociology, we have lots of studies of individual cities, but very few studies that compare across cities, or cities and suburbs,” Bader explains. (Training and hiring different raters in different places can introduce unacceptable elements of uncertainty.) “With CANVAS, it becomes possible to do the entire country. We have started doing comparisons across multiple cities.” His D.C.-based team has used CANVAS to gather data in Philadelphia, Detroit, San Jose and New York City.
That broadens the impact of research, and also raises some interesting questions about what kind of characteristics matter in different places. Buckled and cracked sidewalks, for example, might be a sign of disorder in Boston — but in Los Angeles, they’re as common as front yards.
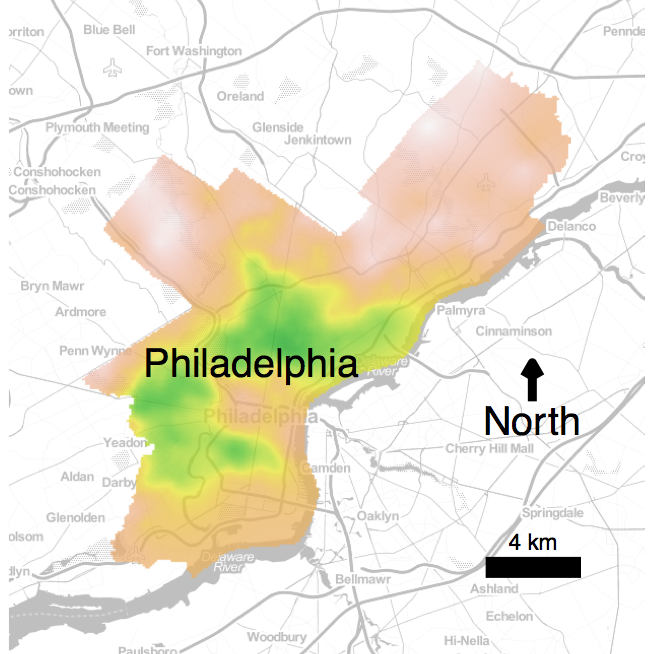
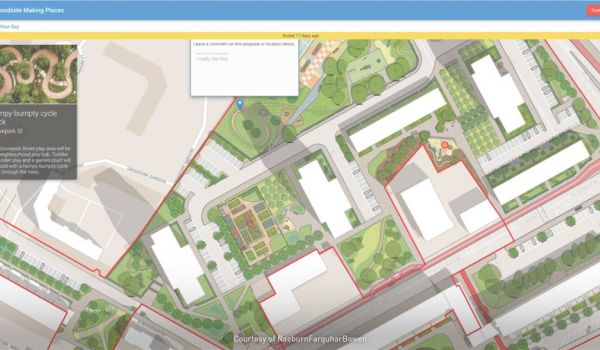
This Philadelphia map is a visualization of the rating work being done by sociology researchers at American University using a tool called CANVAS, which relies on Google Street View. The more green the location on the map, the more “physical disorder” that exists there, according to the team’s assessment. So, North and West Philly, areas dealing with the consequences of decades-long racial segregation and poverty, have more green. (Credit: Mike Bader)
Bader set up a version of CANVAS for me to try, from a rater’s perspective, last week. (Other researchers have relied on Street View, but this is the first application to merge the questions into the Street View API.) Going back and forth on a block of D.C.’s Shaw neighborhood with the familiar, jumpy gait of Street View’s controls, I was asked a handful of questions about what I saw. How much of the sidewalk was covered by awnings? Was there a bus stop? Were there check-cashing establishments?
Having finished that assignment, I was whisked away to Georgetown to answer the same questions. And then to Anacostia. It was slow going at first, but once I learned what I was looking for, it was very easy work. It took me just a few minutes to survey four blocks, and my legs felt fresh.
My mind, on the other hand, was not exactly stimulated. Bader worries about the effect that repetitive computer work has on raters.
With CANVAS, a research director can choose to assign each rater a particular feature and have that person cover a whole survey area in just a few hours. (Or bounce around a city at random, as I did.) You can see the advantage in having, say, some researchers focused on facades and some on sidewalks. But with specialization, Bader concedes, “it gets a lot more boring. And that means the quality of ratings go down.”
There’s another obvious shortcoming to using Street View as a proxy for site visits. It doesn’t matter to sociologists as much as it does to tourists, but there remains a sensory gap between virtual exploration and firsthand observation. So much of a neighborhood’s fingerprint is non-visual. The smell of a nearby factory or of diesel fumes, the babble of smokers outside a bar, the rattling of train tracks — all these are crucial components to evaluating the experience of urban life, and Street View is blind to them.
A hot issue in sociology, for example, is correlating sleep patterns with health outcomes. But to understand how a neighborhood sleeps, you need to understand how noisy it is. Municipal sound-gathering efforts, like Washington, D.C.’s gunshot sensors, are both expensive to create and far from comprehensive. (ShotSpotter covers only about a third of D.C.)
So how long before Google Street Sound comes out?
The Science of Cities column is made possible with the support of the John D. and Catherine T. MacArthur Foundation.
Henry Grabar is a senior editor at Urban Omnibus, the magazine of The Architectural League of New York. His work has also appeared in Cultural Geographies, the Atlantic, The Wall Street Journal and elsewhere. You can read more of his writing here.
Follow Henry .(JavaScript must be enabled to view this email address)