Despite ominous election-year prognostications on the state of the economy, the annual U.S. Census Bureau’s Current Population Survey results contain some good news for a change: Incomes are up, and the poverty rate and percentage of people uninsured are down.
Between 2014 and 2015, for the first time since before the 2008 recession, median household income increased — by 5.2 percent, up to $56,516 in 2015 from $53,718 the year before. That’s still 1.6 percent lower than in 2007, and while most U.S. regions and racial groups saw a boost, there was a distinct divide between urban and rural areas. Households in metro areas saw a 6 percent increase in median incomes, from $55,920 in 2014 to $59,258 in 2015. Households in the “principle cities of metropolitan areas” saw a 7.3 percent increase over the same time period. Suburban households — those in metro areas but outside of principle cities — had the highest median income at $64,144.
At the same time, households in rural areas or small towns didn’t see a statistically significant change in median income, and had the lowest median income — $44,657. Similarly, the poverty rate dropped to 13 percent in metropolitan statistical areas — down from 14.5 percent in 2014 — but the poverty rate outside of metro areas remained almost unchanged at 16.7 percent. The actual number of non-metro residents in poverty did drop, from 8.2 million in 2014 to 7.4 million in 2015. The poverty rate for those living in metro areas but outside the principle cities also dropped from 11.8 percent to 10.8 percent, while the rate in principle cities dropped from 18.9 percent to 16.8 percent. Nationwide, the poverty rate decreased in 2015, down to 13.5 percent from 14.8 percent the year before. That’s 43.1 million people in poverty in 2015, 3.5 million fewer than in 2014.
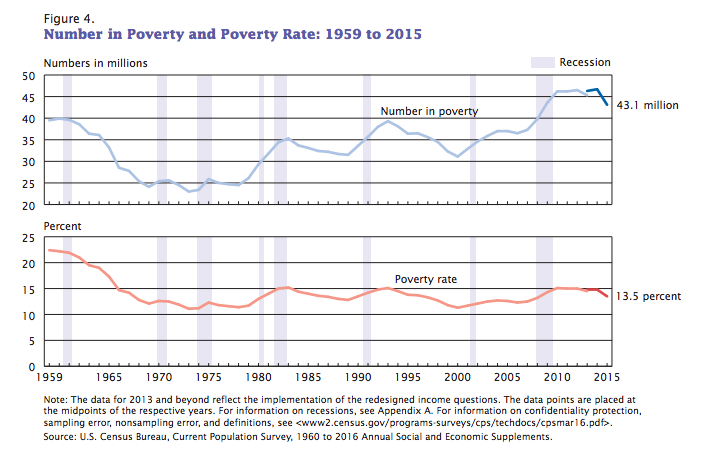
(Credit: U.S. Census Bureau)
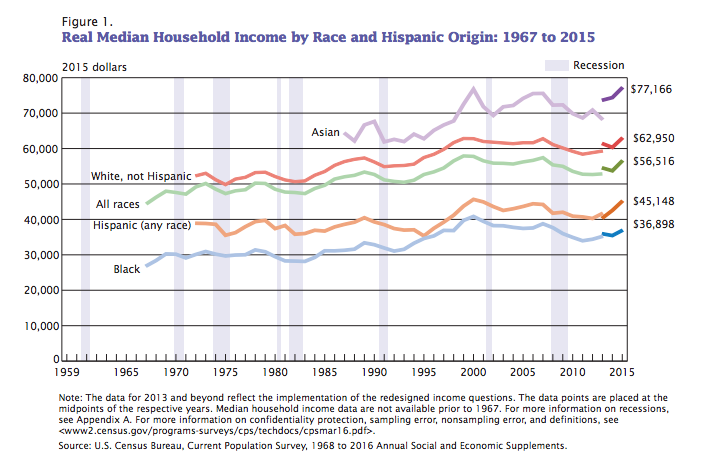
Across geographic areas, real median income increased for non-Hispanic white, black and Hispanic households by 4.4 percent, 4.1 percent and 6.1 percent, respectively. That left real median incomes at $62,950 for non-Hispanic white households, $36,898 for black households and $45,148 for Hispanic households. Asian households had the highest median income at $77,166, but saw no significant change over 2014. Households headed by a foreign-born person saw a real median income increase of 5.3 percent to $45,137, compared to a 4.4 percent increase for households headed by a native-born person, which are up to $57,173.
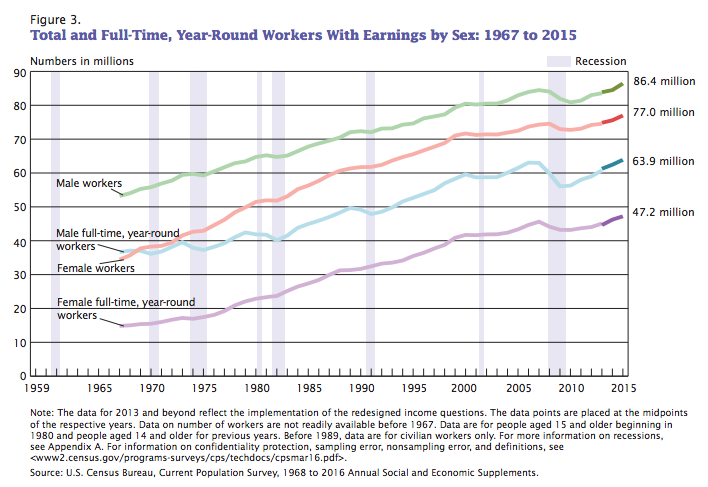
The report, “Income and Poverty in the United States: 2015,” also found that the number of people working full-time year-round increased by 1.4 million for men and 1 million for women. Men saw a 1.5 percent increase in real median earnings, while women saw an increase of 2.7 percent. The female-to-male earnings ratio remained at 0.8, not significantly different from the year before. Men’s median earnings were $51,212 in 2015, while women’s were $40,742.
(Credit: U.S. Census Bureau)
While incomes increased for nearly everyone, income inequality didn’t decrease. 2015 saw no statistically significant change on the Gini Index, which attempts to measure income inequality, but it did indicate that income inequality has increased since 1999.
A second report also indicated that the percentage of people without health insurance also decreased by 1.3 percentage points between 2014 and 2015, meaning 90.9 percent of the population had health insurance for all or part of the year. Private health coverage was more prevalent than public coverage, at 67.2 percent compared to 37.1 percent. Employer-provided insurance covered 55.7 percent of the population for all or part of the year, followed by 19.6 percent on Medicaid, 16.3 on Medicare, 16.3 percent on direct purchase, and 4.7 percent on a military plan.
The Current Population Survey is administered by the U.S. Census Bureau and U.S. Bureau of Labor Statistics. It is the primary source of labor force statistics in the U.S. and used to calculate monthly unemployment rate estimates. Data is gathered through monthly surveys.
Jen Kinney is a freelance writer and documentary photographer. Her work has also appeared in Philadelphia Magazine, High Country News online, and the Anchorage Press. She is currently a student of radio production at the Salt Institute of Documentary Studies. See her work at jakinney.com.
Follow Jen .(JavaScript must be enabled to view this email address)