
These days, Austin is nearly synonymous with “tech savvy,” but the city’s Office of Sustainability launched a new platform this week that provides even the non-coders among us easy, transparent access to city data.
After several years of publishing a static yearly government report card, and of posting data sets to an online open data portal, the city has rolled out a new, easier-to-understand public-facing dashboard powered by Socrata. The dashboard tracks 50 indicators across 10 categories, including food and health, energy, water, built environment, and zero waste.
Each of these categories is tied to an aspect of the city’s sustainability plan, to a specific department’s goals, or to another policy or master plan. Users can easily see where the city is meeting its stated targets — and where it’s falling short.
“It’s really about connecting plans and policies to individual data points,” says Lewis Leff, a senior consultant in the Office of Sustainability. Citizens are accustomed to their governments setting goals and quietly failing to achieve them. The dashboard, says Leff, provided a chance to be transparent about when progress is on course, and when it isn’t.
First, the department had to decide which data points were feasible to track. “When you do an indicator project you really want to make sure they’re accurate, reported on a regular basis,” says Leff. Some metrics didn’t have enough data; others couldn’t be updated frequently enough.
Then there was the fact that the behind-the-scenes information gathering was and remains nearly entirely manual. The Office of Sustainability had to reach out to over 40 departments across the city to collect the data and keep it up to date. Doing so for hundreds of data points just wasn’t feasible.
Ultimately, Leff says the department is working to automate that process. In the meantime, they narrowed it down to 50 indicators of the city’s progress toward eco-friendliness, ranging from the apparent to the obscure. According to the dashboard, for example, Austin has planted 7,262 trees, far surpassing its main ecosystem goal of planting 3,960 trees by 2016. But the city hasn’t yet met its goal of purchasing only 100 percent recycled content paper: 83 percent is recycled content right now.
“As a large organization with a $3.7 billion budget, we do a lot of purchasing,” says Leff, so procurement represents an opportunity — however invisible to the public — to reduce emissions. “When you get down into the details of any indicator, it gets pretty nitty-gritty,” Leff continues. Many of the indicators tied to specific goals relate directly to city operations. In the food and health category, the portal tracks the percentage of population that is food insecure, the number of community gardens, the percentage of Austinites under 65 without health insurance, etc. But the main goal is tied to the number of city employees engaging in wellness activities. (Goal achieved, by the way.)
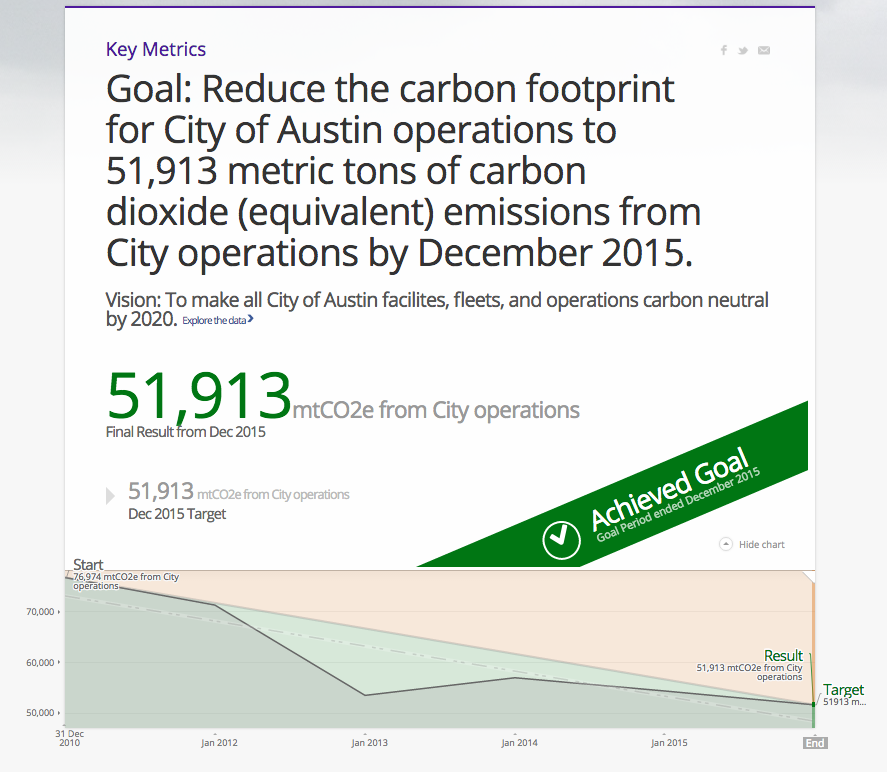
In the climate category, the city has achieved its 2015 goal, reducing carbon emissions from city operations to 51,913 mtCO2e. The long-term vision is carbon neutrality for city operations by 2020, and net zero emissions citywide by 2050. The Community Climate Plan from which many of these goals are drawn was adopted before the Paris climate talks last year, but Leff says it’s still ambitious enough to help the nation as a whole reduce emissions to the necessary degree.
Many of the remaining indicators aren’t tied to a goal, but rather presented to the public in a bid to improve informed decision-making, Leff says. The number of charges in the city’s network of electric vehicle stations is being tracked, for example, and the amount of parkland being preserved. If the city continues to track data with enough detail, it should help policymakers see whether devoting more resources to an issue helped, or whether cutting staff hurt, and so on.
It’s all still just a little clunky. I had a hard time figuring out the connection between the city-operation goals and the community-wide data, and the dashboard doesn’t show goals for 2016, only whether goals from 2015 have been met or not. So I could see the city had met its carbon emissions reduction target for 2015, but I don’t know Austin’s 2016 target or whether the city is on track to meet it and ultimately the 2020 carbon neutral goal.
(Credit: Austin Office of Sustainability)
Leff explains the absence of future targets is in part a constraint imposed by the software. In order to report whether last year’s goal was met or still needs improvement, the date for the goal needs to exist in the past. He says the dashboard will update with the 2016 data when it becomes available, and that the department will look into displaying future goals in upcoming software updates. He also stresses the importance of collecting data over the long term, as it becomes more valuable the longer it’s tracked. In the climate category, for example, the Office of Sustainability is tracking the annual number of days above 100 degrees, noting that “the impact of [carbon] emissions in the environment is reflected through Austin’s climate.” But with data since only 2011, the trend is actually downward.
Leff says it’s not the city’s role to frame that information, only to present it to the public in the spirit of transparency, and to keep collecting and keep publishing. “If it’s a downward trend for four years, but it’s been an upward trend for 20, we would love to show that but we’re only going to be able to do that if we start reporting on it on a regular basis,” he says.
Before this public-friendlier version launched, Austin’s civic tech community had already made ample use of the open data portal. They’ve developed a pet finder app that provides near-real-time access to the local animal shelter’s data, and a more streamlined process for candidates for public office to input their campaign finance data. They even helped keep the city accountable while working on the open data platform. With more visualizations and context, the new platform allows people to “understand more of the story around data, which I think has been really important for the public but also for the departments,” says Matt Esquibel, IT division manager at the city of Austin.
“Sometimes you have buy-in from the public but the departments don’t always get it,” he continues, “so adding this context has been helpful for tracking the momentum departments already have or the activities they’re already doing.”
Jen Kinney is a freelance writer and documentary photographer. Her work has also appeared in Philadelphia Magazine, High Country News online, and the Anchorage Press. She is currently a student of radio production at the Salt Institute of Documentary Studies. See her work at jakinney.com.
Follow Jen .(JavaScript must be enabled to view this email address)