A nifty new tool reveals how well your city’s public transit shuttles people back and forth between where they live and work. The interactive tool, released Tuesday by TransitCenter and the Center for Neighborhood Technology, provides insight into how many jobs are within a half-hour transit commute of an address, how many commuters in a given area bike to work and more. AllTransit aggregates data from more than 800 transit agencies into a comprehensive set of metrics and maps that break down public transportation opportunities by census block.
Information about 543,000 transit stops, 15,000 routes and their frequency are overlaid with a wealth of data about health, equity and economic development. The tool can reveal not only the proximity of jobs, but the type of work, pay grade and educational attainment needed; not only the number of households near transit, but also the number of Low Income Housing Tax credit buildings near transit; not just the number transit routes within a half-mile, but also the number of bike-share hubs, car-share locations and even farmers markets.
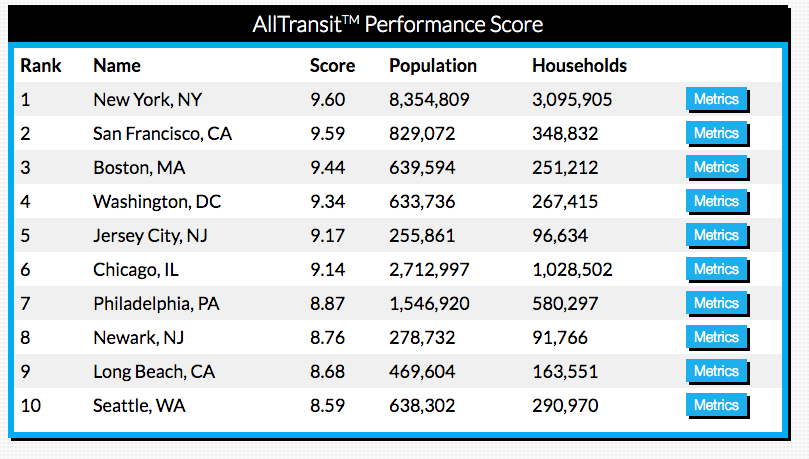
All of this information, including what percentage of commuters use transit, is aggregated into a performance score between one and 10. New York City, predictably, tops the nationwide list of big cities with a score of 9.6. But, also predictably, more than half of the several thousand municipalities included in the list have a score below three, indicating a “low combination of trips per week and number of jobs accessible enabling few people to take transit to work.” The U.S. as a whole gets a score of 3.1. The American Society of Civil Engineers’ has found that 45 percent of Americans have no access to transit at all, and millions more are without adequate service.
AllTransit’s data includes metropolitan areas whose populations were greater than 100,000 in 2013, as well as a large number of smaller municipalities. Large transit agencies already release public General Transit Feed Specification (GTFS) data, which powers apps like Google Maps. AllTransit also created an online tool to gather data from smaller agencies without GTFS, about a third of the total data set.
The tool is intended to help further planning and advocacy efforts by identifying gaps in cities’ transit networks. The U.S. DOT recently announced a similar initiative to create a National Transit Map of stops, routes and schedules from as many local and regional transit agencies as possible. That program also draws on GTFS data, from agencies being asked to willfully disclose it.
One nice funcition of AllTransit is that you can type in any address and see the transit score for that point. Here’s what it shows you:
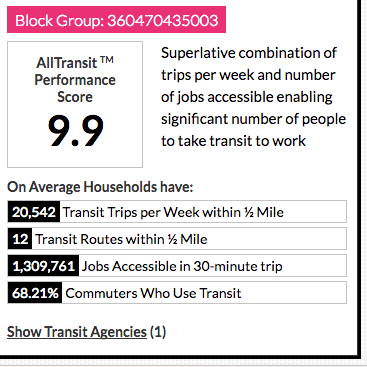
Not surprisingly, my former Brooklyn address scored very high.
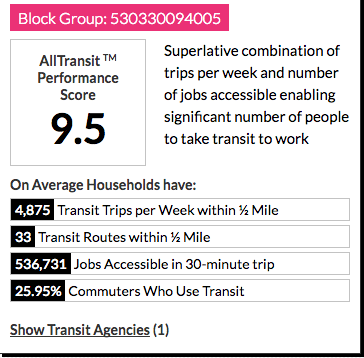
While my current address in Seattle also scored quite high, there is a much lower percentage of transit users than for my Brooklyn address.
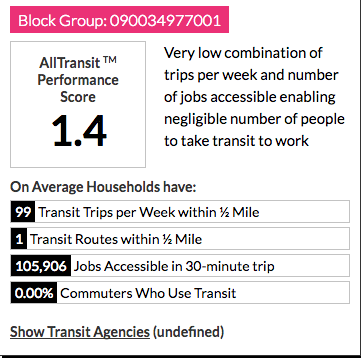
My parents address in a suburb of Hartford, Connecticut, on the other hand, scored dismally. Not surprisingly, no commuters there rely on public transit.
Jen Kinney is a freelance writer and documentary photographer. Her work has also appeared in Philadelphia Magazine, High Country News online, and the Anchorage Press. She is currently a student of radio production at the Salt Institute of Documentary Studies. See her work at jakinney.com.
Follow Jen .(JavaScript must be enabled to view this email address)