The Delaware Valley Regional Planning Commission yesterday released a free, online mapping program, designed to make tracking the flow of government and non-profit dollars throughout the region much easier.
Called the Community Investment Index, or CI2 for short, the program is designed to represent how funds for things like transportation, economic development and affordable housing — along with nearly 100 other factors — are distributed across the Delaware Valley. The program was designed to increase planners and private citizens’ understanding of where place-based investments are being made, and also highlight areas where strategic investment could have a greater impact due to a dearth of spending.
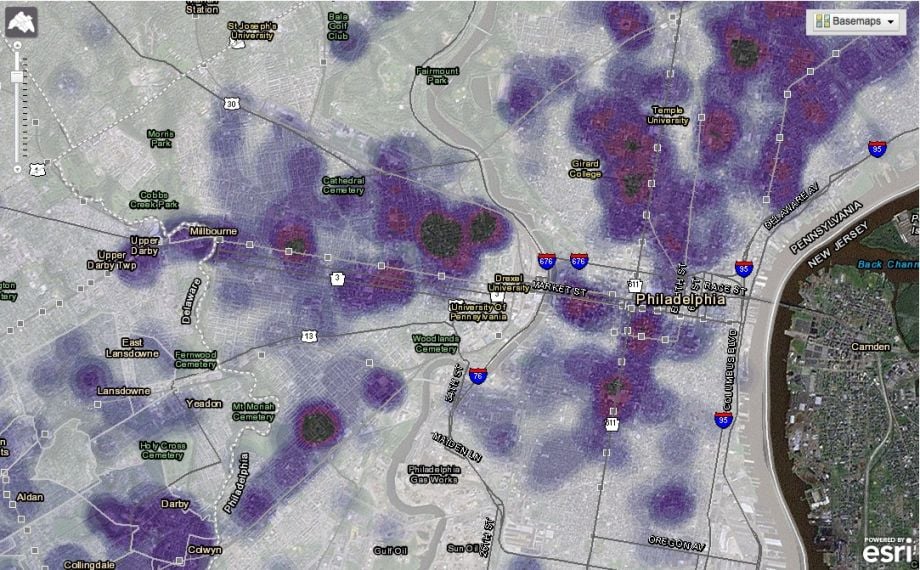
On the surface, the map can seem deceptively simplistic. Darker colors, with shading to indicate higher investment levels, are unsurprisingly clustered around denser areas like the city of Philadelphia and the region’s town centers. However, clicking on one of those concentrations opens up a secondary mapping program that reveals every single dollar or planning resource used in a specific area, as well as what it was used for and by whom.
In some ways, the map can also be misleading. Some areas have their overall “investment” levels boosted by the presence of things like government-owned land, whether developed or not. Other areas get bumps for being included in simple planning analysis zones. Both are technically forms of investment, but have little tangible impact on the ground.
However, in a way this can help serve the purpose of CI2. Ideally, a better representation of where money is being spent will make it easier for the average person to gauge the efficacy of neighborhood investments. All one needs to do is compare clusters of spending with reality.
_200_200_80_c1.jpg)
Ryan Briggs is an investigative reporter based in Philadelphia. He has contributed to the Philadelphia Inquirer, WHYY, the Philadelphia City Paper, Philadelphia Magazine and Hidden City.