Mapping company ESRI recently released an update to its Tapestry Segmentation system, which identifies 67 different archetypes — “Metro Renters,” “Trendsetters” — of Americans as consumer markets. With this new edition, it combines census and marketing data to create a searchable map of the U.S. that allows users to parse by zip code.
Some of the profile tags might elicit a smirk, like “Laptops and Lattes” and “Soccer Moms,” but the way that coded language crops up when sizing up low-income urban neighborhoods reveals a more unsettling truth about how marketers jockey information about race, ethnicity and gender in order to influence spending habits.
In fact, the language that ESRI and other data brokers use to flatten populations down into segments can end up sounding an awful lot like disturbing stereotypes.
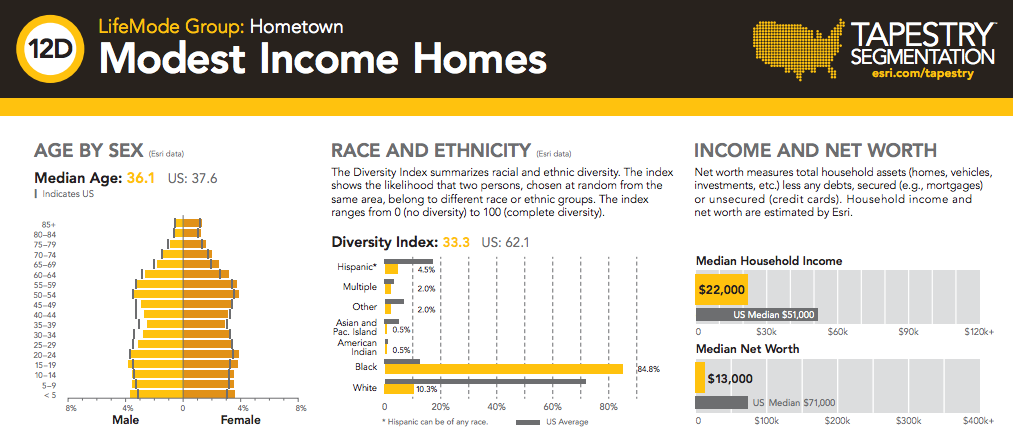
When a sneaker company releases a new NBA player-endorsed product, like the latest edition of Nike’s LeBrons or Air Jordans, they could search ESRI’s database for the “Modest Income Homes” category and then target radio and television ads at those zip codes. ESRI’s description for “Modest Income Homes” reads, “We play basketball, watch a lot of TV, and will buy products endorsed by celebrities. Radios are tuned to gospel and R&B stations.” The use of first-person plural voice unsettlingly captures the process’s lack of individuality.
(Illustration by Anthony Smyrski; click to enlarge)
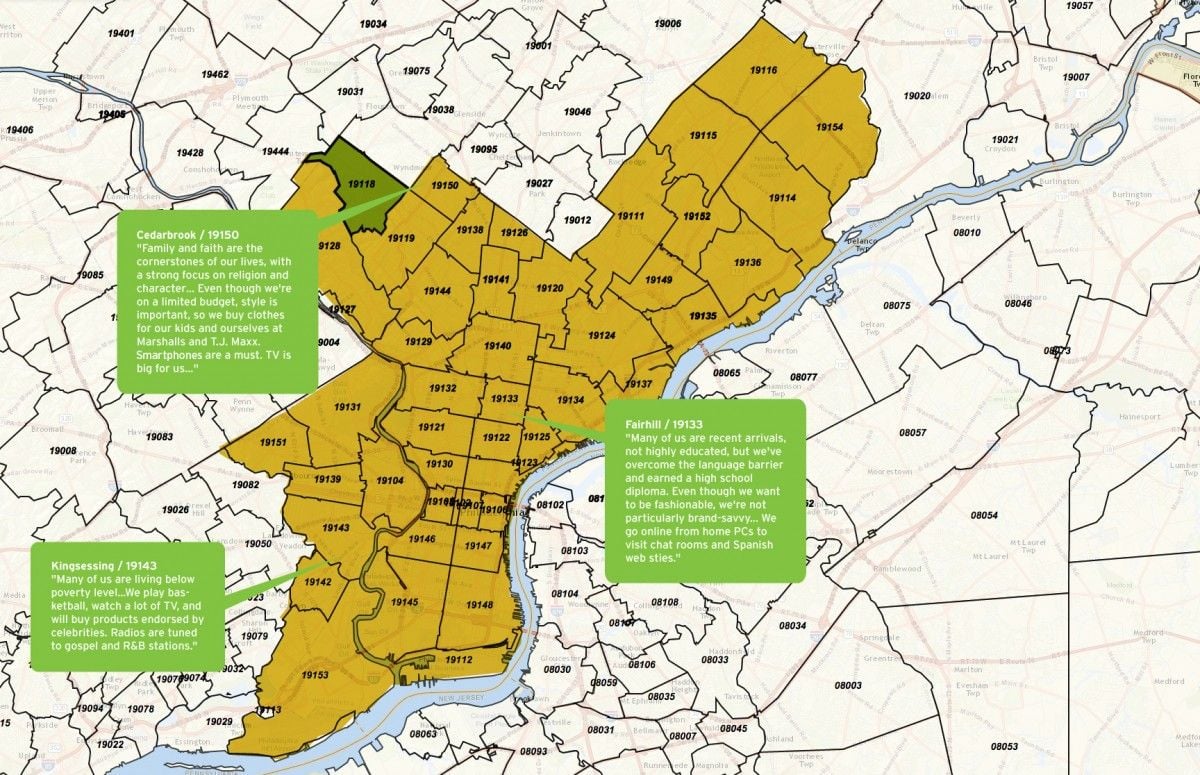
“Modest Income Homes” is the largest demographic group that ESRI identifies for the Philadelphia zip code of 19143. Median income is around $28,000. “Jobs are often hard to come by,” reports ESRI, “so Social Security, public assistance, and Medicaid really help us to scrape by. Many of us are living below the poverty level.”
Credit: ESRI
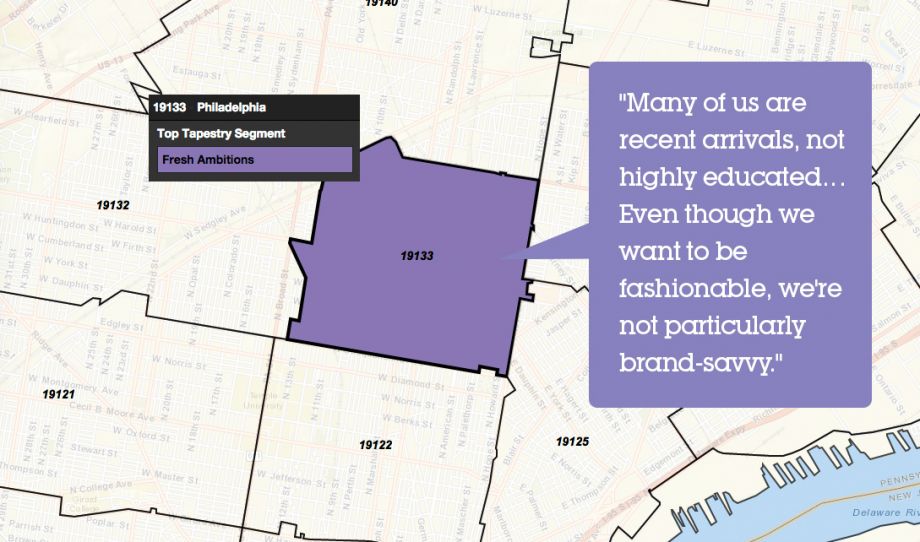
“Fresh Ambitions” households dominate the Philadelphia zip code 19133 (which encompasses the predominately Latino neighborhood, Fairhill). “Many of us are recent arrivals, not highly educated,” explains ESRI, “but we’ve overcome the language barrier and earned a high school diploma. Even though we want to be fashionable, we’re not particularly brand-savvy … We go online from home PCs to visit chat rooms and Spanish websites.”
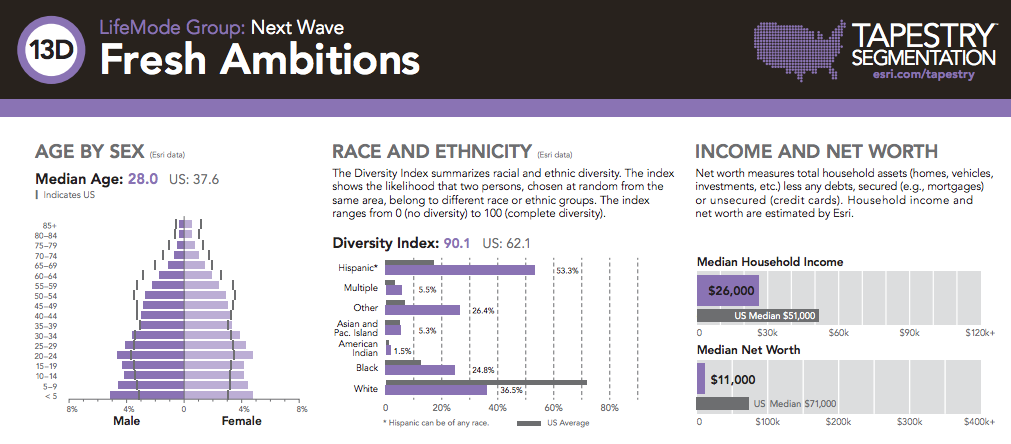
Credit: ESRI
Target marketing isn’t anything new, but how sophisticated it has become in the past decade has led to fears that the government and civil rights groups are underprepared to combat the discriminatory practices of big data.
In 2012, Sen. Jay Rockefeller, chairman of the Committee on Commerce, Science and Transportation launched an investigation into the data broker industry. One of the Committee’s reviews outlined the dangers of big data-powered marketing. It reported that marketing can pair consumers with products and services based on their interests in a mutually beneficial arrangement, but “it can become a different story when buckets describing consumers using financial characteristics end up in the hands of predatory businesses seeking to identify vulnerable consumers, or when marketers use consumers’ data to engage in differential pricing.”
In February, Rockefeller sent letters to data brokers who were known to create lists of vulnerable consumers based on financial or health information. Some lists that have been reported to use labels like “Empty Wallets,” “African American Pay Day Loan Responders,” “Dementia Sufferers” and “Ethnic Second-City Strugglers.”
Even though these categorizations are more unsavory than ESRI’s monikers, it shows how there’s a slippery slope when markets are segmented so granularly and so geographically that they can’t help but facilitate discriminatory practices and vulturing.
“During the subprime lending boom, mortgage brokers were blending cookie data that tracks behavior and user data gathered from sites like Bankrate.com, along with geographical and other demographic data, to easily infer race,” warns Seeta Peña Gangadharan in a New York Times op-ed. “This data mining helped brokers — or the marketing companies they hired — target minorities with ‘ghetto loans,’ sometimes couched in the ‘language of African-American.’”
Despite the fact that African-Americans drink less and binge-drink less, on the whole, than other demographics, those few who do drink are more likely to have drinking problems so alcohol companies tend to over-market to African-American youth. Last week, The Washington Post reported on the booming “rent-to-own” business model that targets the poor, who end up forking over substantially more money for electronics and furniture because of the inability to make large purchases.
In May, the White House released a report, which addressed some of the dangers of data brokerage, including evidence that retailers were providing more discounts to higher-income areas than poorer areas.
..[T]he ability to segment the population and to stratify consumer experiences so seamlessly to be almost undetectable demands greater review, especially when it comes to the practice of differential pricing and other potentially discriminatory practices. It will also be important to examine how algorithmically-driven deceptions might exacerbate existing socio-economic disparities beyond the pricing of goods and services, including education and workforce settings.
ESRI’s “Top Tier,” or richest category, is unsurprisingly majority white. They “shop at high-end retailers such as Nordstrom (readily paying full price), as well as Target, Kohl’s, Macy’s, Bed Bath & Beyond, and online at Amazon.com.”

Credit: ESRI
“Segmentation provides an accurate, revealing look at your existing and prospective customers and their trade areas to provide the best marketing opportunities,” ESRI Data Product Manager Cathy Spisszak told the Houston Chronicle. “Segmentation can also reveal less profitable areas that you can avoid, thereby enabling you to save time and marketing dollars.”
Data brokerage greases the wheels of inequitable distribution of goods and services to poorer neighborhoods. Concurrently, the value judgements placed on purchasing choices (the “High Rise Renters” segment: “Because we like to look good, we’ll sometimes spend more for clothes than we should”) exacerbate those exact same consumer habits.
And if the zip code-level glimpse into how marketers view certain communities isn’t revealing enough, ESRI offers an even more hyper-local option: Subscribers can view its Tapestry Segmentation down to the census block and group levels.
The Equity Factor is made possible with the support of the Surdna Foundation.

Alexis Stephens was Next City’s 2014-2015 equitable cities fellow. She’s written about housing, pop culture, global music subcultures, and more for publications like Shelterforce, Rolling Stone, SPIN, and MTV Iggy. She has a B.A. in urban studies from Barnard College and an M.S. in historic preservation from the University of Pennsylvania.