Here’s part two of our urban growth visualization GIFs (see more sprawl GIFs for U.S. cities in “These Cool GIFs Show How 8 U.S. Cities Have Sprawled”), showing the density of new construction over each decade since the 1940s, created by Ian Rees. The original visualization, of sprawl in Houston, is shown to the right, to provide a scale for the others.
Boston
Boston, the GIF shows, is an overwhelmingly prewar metropolitan area. The suburbs see light blue residential growth, especially throughout the ’50s and ’60s. New housing construction in the city proper and its most urban suburbs is very sparse from the beginning of World War II onward, until reviving somewhat by the ’70s, although much of the innermost growth involved the construction of large, government-funded complexes, as with the Boston Housing Authority’s massive Charlestown projects. Growth then declines through the ’90s to pretty much nothing, in all parts of the region, before rebounding in the period from 2000 to 2010 in the inner-city, with the prewar parts of Boston proper seeing their strongest growth since the Second World War.
D.C.-Baltimore
In the D.C.-Baltimore region, growth flees the cities proper during the postwar era. The Northwest quadrant of Washington sees a fair amount of development in the ’40s and ’50s, but even that slows to a trickle by the ’80s and ’90s. Baltimore’s core area, around the Inner Harbor, sees renewed development by the 2000s, as does D.C.‘s, where growth is centered around downtown.
D.C.‘s suburbs see the normal strong, sprawling growth from the ’60s through the ’80s, but in the ’90s and 2000s, something interesting starts happening: Suburban growth turns inward, not to the city center, but to the suburban core nodes, reflecting the region’s unique designation as the only place in the U.S. that’s seen strong, widespread urbanization of its suburbs. The Orange and Blue lines through Northern Virginia see particularly dense infill, and even the growth beyond the reach of the Metrorail system is concentrated in the tracts adjacent to the region’s highways, especially to the west of the capital.
Dallas-Ft. Worth
The Dallas-Ft. Worth Metroplex, in Texas, sees a largely Phoenix-like growth through the ’90s, with growth radiating outward in an unmitigated sprawl. Growth in the urban core returns in the ’90s and then intensifies in the 2000s, mirroring Houston’s trajectory, but it doesn’t reach as far from the downtown as in Houston, where the west side sees strong growth as well, likely due to the fact that Dallas is a zoned city where desirable inner-city neighborhoods that are not in the downtown core are more able to fend off densification through regulation. (Dallas also saw less growth overall than Houston, with a mere 6.7 percent housing stock growth rate in the 2000s — less than half of Houston’s.) Dallas also sees more sprawl than Houston in the 2000s — areas like McKinney in Collin County and Little Elm in Denton County, well north of the city limits, see huge amounts of new construction — perhaps given that less of the demand can be absorbed by the core.
Seattle
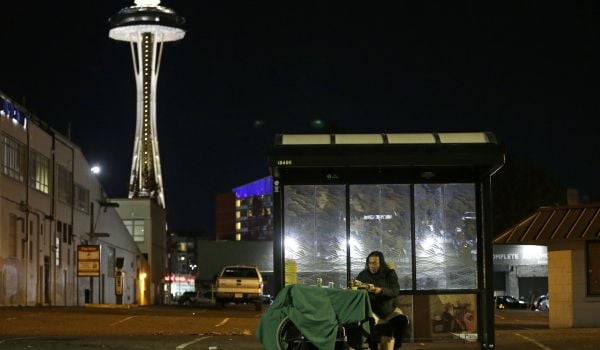
In stark contrast to cities like Dallas that sprawled for decades before finally seeing strengthened inner-city growth over the last decade, construction in Seattle’s core has been gradually and steadily strengthening since the 1970s, even as it’s continued to sprawl. And from 2000 to 2010, it wasn’t just the innermost downtown core that was growing — it was essentially all of inner Seattle south of Lake Union and north of I-90. (Indeed, in the first decade of the new millennium, the city of Seattle grew its housing stock by about 14 percent, one of the highest rates in the U.S.)
San Diego
San Diego, like all coastal California cities, has seen massive upticks in demand throughout the region, for both sprawl and densification. Unfortunately, like Los Angeles, it doesn’t have a regulatory regime in place to allow this demand to manifest itself as new construction beyond downtown San Diego, which is the only part of the metropolitan area that has seen significant densification from 2000 to 2010. Demand is actually highest not in downtown, but along and near the Pacific coast, in communities like La Jolla, Del Mar and Encinitas, where construction peaked in the ’70s and has since dwindled to near nothingness. As in Los Angeles, if San Diego is ever going to become a truly urban place, all of these high-demand coastal neighborhoods will have to be built out more densely, not just the small swath of land downtown where there aren’t many existing residents to upset.
The Works is made possible with the support of the Surdna Foundation.
Stephen J. Smith is a reporter based in New York. He has written about transportation, infrastructure and real estate for a variety of publications including New York Yimby, where he is currently an editor, Next City, City Lab and the New York Observer.

_600_350_80_s_c1.jpg)