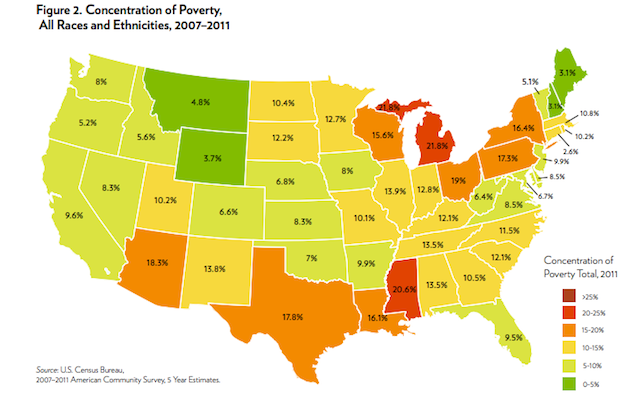
Concentrated poverty has increased by 50 percent since the turn of the century, according to new research from the Center for Urban Research and Education at Rutgers University (CURE). More than 11 million Americans live in neighborhoods where at least 40 percent of households are below the poverty line. That equates to a family of four bringing in roughly $23,000 a year.
These are neighborhoods, in other words, where two in five households don’t earn enough to survive on.
As you can see in the map above, Michigan and Mississippi have it the worst, with more than one in five poor people living in concentrated poverty. CURE director Paul A. Jargowsky compared 2000 Census data with the 2007-2011 American Community Survey to find his results.
“Concentration is greatest in the Mid-Atlantic, Midwest, Mississippi, and Southwest,” Jargowsky wrote.
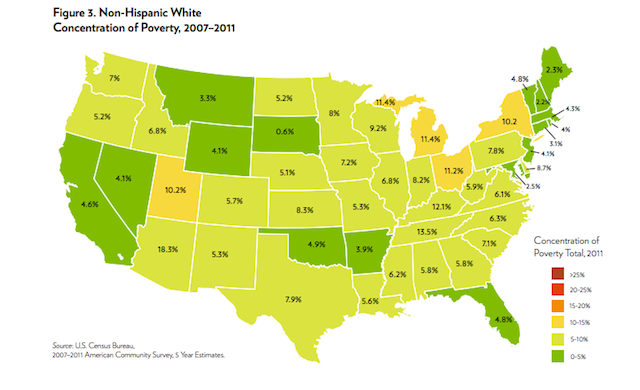
The data was also broken down by race. The percentage of non-Hispanic white people living in poverty was relatively low, though it doubled from 1.4 million people in 2000 to 2.9 people in 2007-2011. The map below shows current levels of white people living in concentrated poverty.
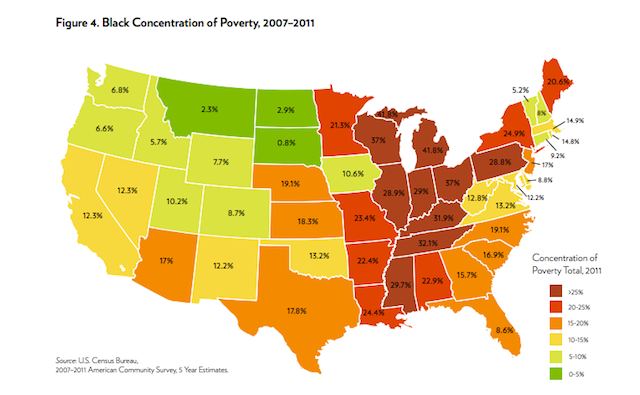
Black concentration of poverty is a world apart from whites, with more than one in four black people living in high-poverty areas in nine states. It’s the worst in Michigan, where 41.8 percent of poor blacks live in concentrated poverty.
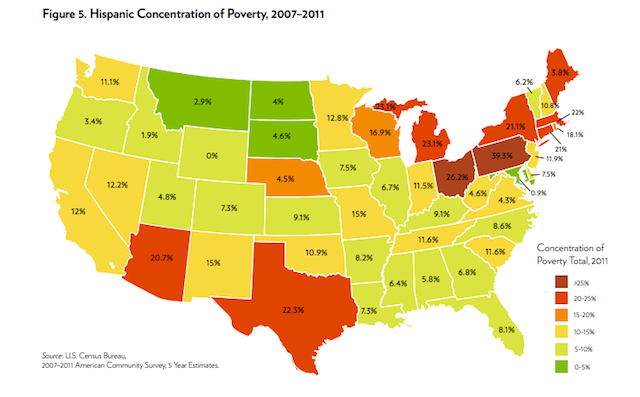
It’s not as dramatic for the Hispanic population, where Ohio and Pennsylvania are the only states that top 25 percent, though Texas (22.3 percent) and Michigan (23.1 percent) aren’t far behind.
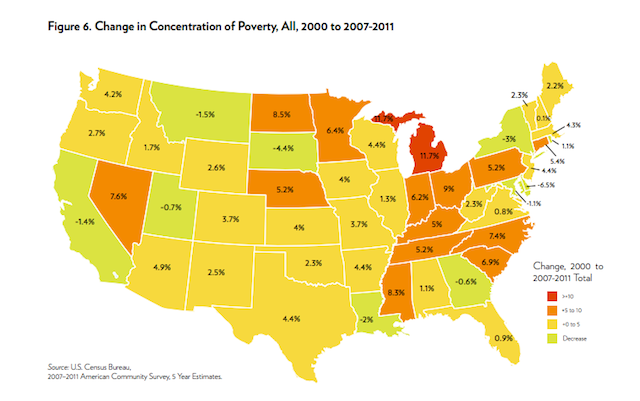
The above maps all show current concentrated poverty levels. The map below illustrates the change in concentrated poverty between the 2000 Census and 2007-2011 American Community Survey, which was the impetus of Jagworsky’s research. Again, Michigan was hit the worst and most states experienced an uptick in concentrated poverty. Only eight states saw a drop in concentrated poverty.
As the data shows, concentrated poverty is noticeably worse for minorities. Jagworsky offered up the raw numbers for a stark comparison:
Concentrated poverty continues to affect black and Hispanic communities disproportionately, with these populations together comprising 67 percent of the 11 million Americans living in high poverty neighborhoods.
The Equity Factor is made possible with the support of the Surdna Foundation.

Bill Bradley is a writer and reporter living in Brooklyn. His work has appeared in Deadspin, GQ, and Vanity Fair, among others.