Finally, there is some hopeful environmental news to share!
New satellite images recently released by NASA show that air pollution is on the decline in some of the largest U.S. cities. In particular, levels of nitrogen dioxide — a brownish gas linked to respiratory problems — have dropped significantly since 2005, the agency’s scientists say. The gas is produced by gasoline combustion in cars and burning natural gas in power plants. Its decrease at a time when more people are consuming energy and driving cars can be seen as a victory for the Environmental Protection Agency and other agencies that enforce clean air regulations. The progress also indicates that new clean air technologies are helping us shrink our environmental footprint. Still, NASA scientists warn that its still far too soon to begin taking strolls under your local smoke stacks.
“While our air quality has certainly improved over the last few decades, there is still work to do — ozone and particulate matter are still problems,” said Bryan Duncan, an atmospheric scientist at NASA’s Goddard Space Flight Center in Greenbelt, Maryland in a published statement. And while air quality may be improving, power plant emissions of carbon dioxide — a greenhouse gas — remain an unmitigated threat.
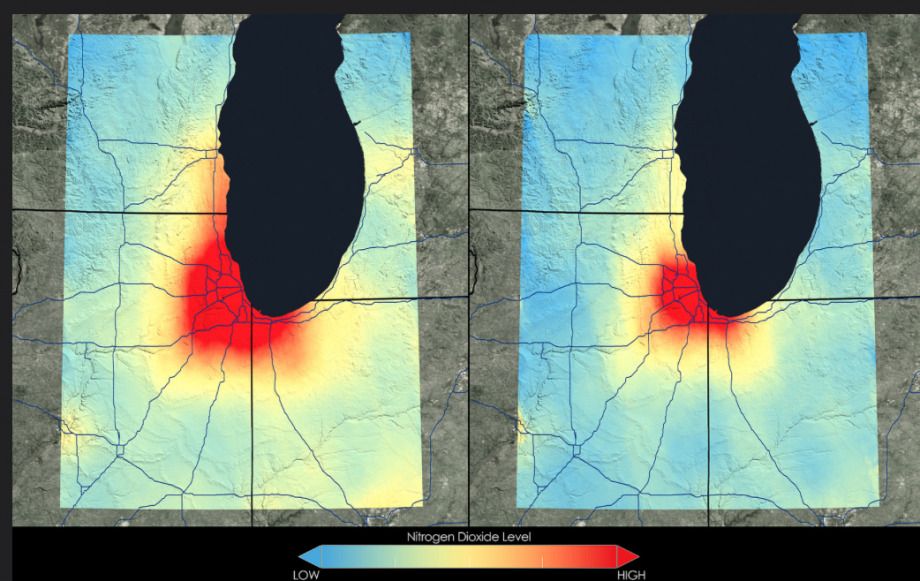
Orange and red areas denote high concentrations and blue and green denote lower concentrations of nitrogen dioxide. (Credit: NASA’s Scientific Visualization Studio, using data from atmospheric scientists Yasuko Yoshida, Lok Lamsal, and Bryan Duncan.)
Click through a slide show of images showing the change in nitrogen dioxide levels in Chicago, Houston, Los Angeles, Atlanta, New York and Denver.
Gallery: Air Pollution
-
Among the cities where NASA measured nitrogen dioxide levels, Chicago experienced the sharpest decline in concentration of the harmful gas, with levels dropping by 43 percent decrease between 2005-2007 and 2009-2011. As visible in this image, levels of the harmful gas were highest above Lake Michigan. (Nasa Scientific Visualization Studio)
-
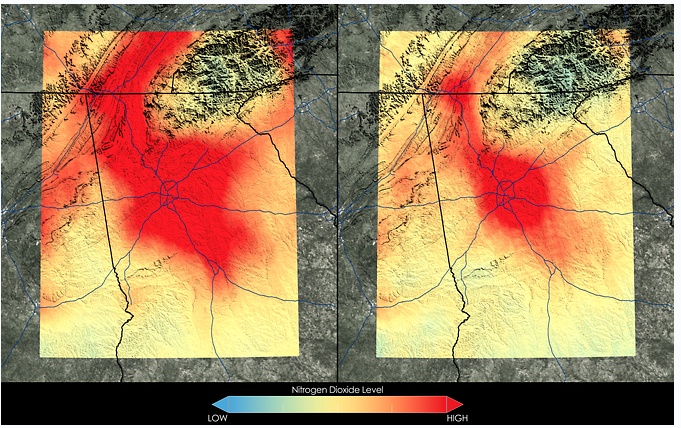
Atlanta saw nitrogen dioxide air pollution levels drop almost as much as Chicago, with a 42 percent decrease between 2005-2007 (left) and 2009-2011 (right). The harmful gas is largely a byproduct of car exhaust and the burning of natural gas in power plants. NASA credits the introduction of more powerful emission control devices on power plants for the cleaner air. (NASA Scientific Visualization Studio)
-
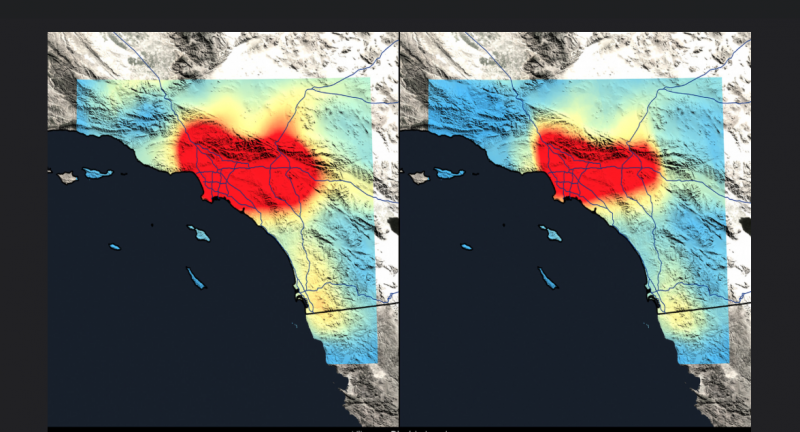
Nitrogen dioxide levels in Los Angeles crept down 40 percent between 2005-2007 and 2009-2011.Though cities in the West tend to have cleaner air than Northeastern cities, L.A.‘s mountainous surroundings make it a trap for pollution. (NASA Scientific Visualization Studio)
-
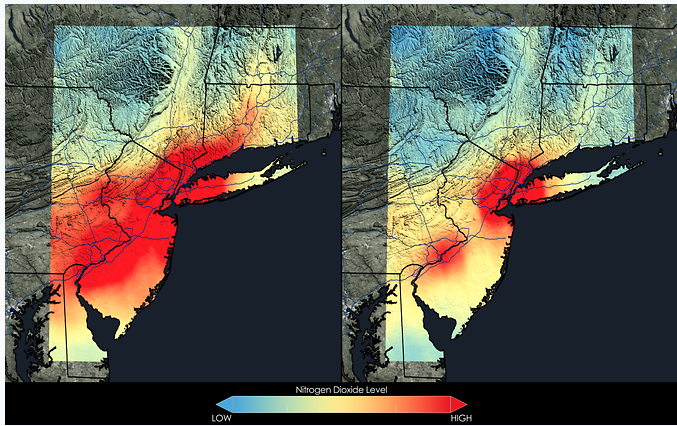
Levels of the lung-aggravating gas decreased by 32 percent in New York City between the 2005-2007 (left) and 2009-2011 (right) periods. Air pollution is endemic to densely populated areas, but even here, the air is gradually becoming cleaner. (NASA Scientific Visualization Studio)
-
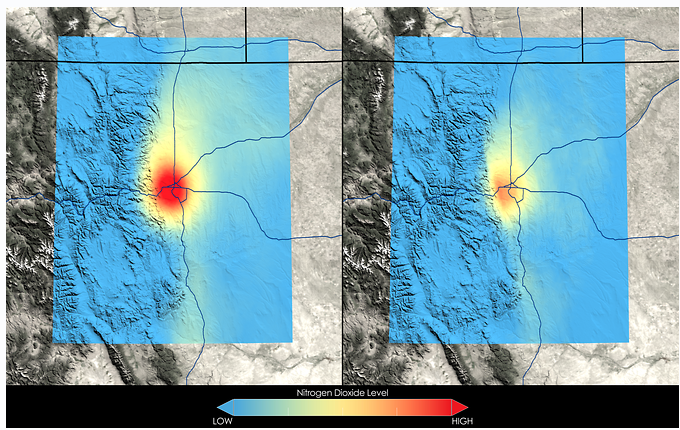
Denver saw nitrogen dioxide levels dip 22 percent between 2005-2007 and 2009-2011, according to NASA. High levels are concentrated in the densest parts of Denver. (NASA Scientific Visualization Studio)
-
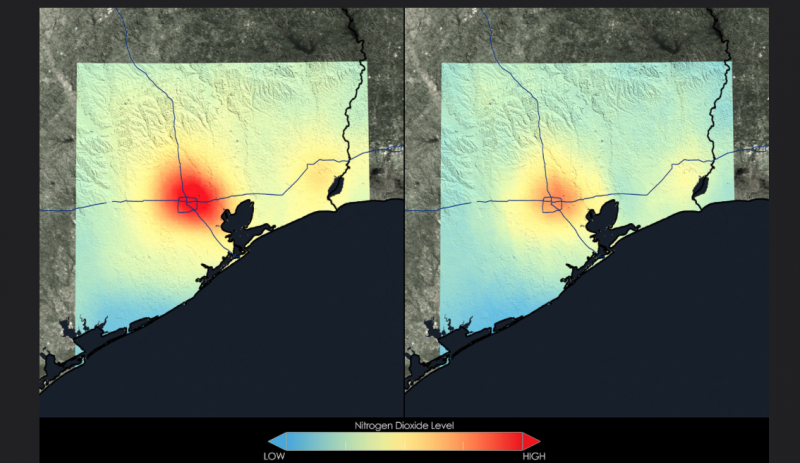
Houston’s nitrogen dioxide levels dipped 24 percent between the 2005-2007 and 2009-2011 periods. The main generator of the gas is industry, which is centered in this image northeast of Beltway 8. (NASA Scientific Visualization Studio)
The Works is made possible with the support of the Surdna Foundation.


_600_350_80_s_c1.jpg)