Funding for this article was provided by:
![]()
The idea of a “poverty line” is a peculiar one, as if all the complexities of human and economic wellbeing could be summed up by a simple binary: have or have not. Born of unimaginative policymaking and perpetuated by the convenience of the status quo, such a black-and-white designation oversimplifies the complicated, dynamic and deeply personal experience of being poor. But more than 40 years since the line’s inception, it is still the barometer for all official poverty statistics collected by the government, and still serves as the baseline for nearly all anti-poverty policies.
Despite its stronghold on American politics, the official poverty measure has modest beginnings, developed in 1964 by Mollie Orshanky of the Social Security Administration. Working on a series of research papers for that office, Orshanky wrote, “To be poor is to be deprived of those goods and services and pleasures which others around us take for granted.” Based on 1950s data from the Department of Agriculture, she determined that any family spending more than one-third of its annual income on necessities (for her purposes this meant only food) should be labeled “poor.”
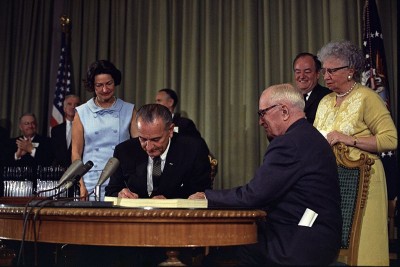
Lyndon Johnson signing the Medicare bill in 1965, a policy set in motion by the War on Poverty.
An “obscure civil servant,” as she was called in retrospect, Orshanky and her work might simply have remained in the archives had it not been for Lyndon B. Johnson’s War on Poverty, waged that same year. Absent any official tool for poverty measurement, the federal government used Orshanky’s calculations to model their own and by 1969, had adopted her definition as the official standard.
Though the line has since been updated to account for inflation, it remains unchanged in principle. Nearly a half-century later, it has yet to acknowledge the substantial rise in Americans’ standard of living, or the profound redistribution of living expenses (food now accounts for only one eighth of the average family’s budget; housing, on the other hand, occupies a significantly larger portion).
And time, it seems, has only served to highlight many of the deficiencies Orshanky’s model suffered from the get-go. Not only is the definition of “necessities” limiting (she considered only the cost of food), but the multiplier three was based on data ten years out-of-date even then. Moreover, when quantifying each household’s resources, the current measure considers only pretax cash income. It ignores fixed expenses, like tax liability and out-of-pocket medical costs, which may push some households into poverty, as well as government aid, like tax subsidies and food stamps, which may lift others out of it.
Today, the inadequacy of the official measure is widely acknowledged. Before her death in 2007, Orshanky herself suggested that the line needed redrawing, and as Rebecca Blank of the Brookings Institution and Mark Greenberg of the Georgetown Center of Poverty, Inequality, and Public Policy jointly state in a recent report, “No other regularly reported economic statistic has been unchanged for four decades.”
However, poverty remains a thorny issue, one whose potential to incite public backlash deters even well-intentioned policymakers from tinkering too much with the status quo. Structural idiosyncrasies only compound this aversion, making change nearly impossible: The authority to redefine the official measure at the federal level resides with the executive Office of Management and Budget. The agency has little incentive to update the line, as a decrease in the poverty rate would mean less authority and fewer funds flowing through the office, and an increase would simply bring bad press. As Blank explains, “Any White House (Republican or Democratic), is likely to see far more costs than gains from such changes.”
Though individual municipal governments have more flexibility to adopt a new measure, Jeremy Nowak of Philadelphia’s Reinvestment Fund feels that city-by-city approaches can be politically dangerous as well. Individual cities that institute their own measure, he says, risk boosting the number of poor and straining the municipal budget, at the same time that the threat of tax hikes and city degradation send wealthy residents and businesses scrambling to the suburbs.
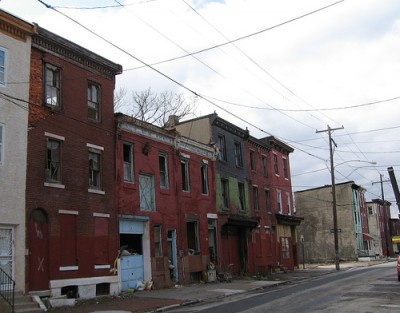
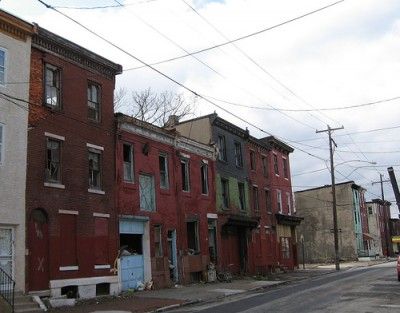
A poor neighborhood in North Philadelphia. Photo by eTombotron via flickr.
Still, some alternative measures have been proposed over the past two decades; one in particular, proposed by the National Academy of the Sciences (NAS) in 1995, has managed to gain traction. The NAS measure sets the poverty threshold higher than Orshanky did, basing its figure on the cost of several necessary household expenses, including food but also clothing, housing, and other expenses. It adjusts the threshold regionally to account for geographical variation in the cost of living. And while the old line measured just pretax cash income, the NAS line adds tax subsidies and in-kind government aid, and subtracts tax liability, out-of-pocket medical expenses and childcare and commuting costs.
So far the official line remains in place, but the NAS line has been making powerful political gains. In 2008 Representative Jim McDermott (D-WA) introduced the Measuring American Poverty Act (MAPA) to the House, at the same time Senator Chris Dodd (D-CT) brought it to the Senate floor. To prevent the sort of administrative upheaval that has deterred change in the past, MAPA proposed the establishment of a “modern” poverty measure (based on the NAS’s recommendations) alongside the “historical” one. While the historical measure would still be used to determine assistance eligibility and to calculate individual allotments, the newer data would be incorporated as anti-poverty programs were reauthorized or modified in the future. Unfortunately, neither bill made it to a vote before the session of 110th Congress expired.
That same year, a report from the Center for Economic Opportunity applied the NAS line to New York City. They found that the percentage of the population living in poverty increased substantially—from 18.9 to 23 percent—and that the profile of individuals living in poverty changed dramatically, with significant jumps in the poverty rates of the elderly, non-Hispanic whites, Asians, and naturalized citizens, and decreases among children living in single-parent families. “Our experience demonstrates that it is possible to measure poverty using a method that reflects the economic, demographic, and public policy realities of contemporary American society,” says Mark Levitan, director of policy research at CEO. “Our work convinces us that an improved poverty measure can be a useful tool for people working to reduce poverty.”
However, the Census Bureau, which has already implemented an NAS-style line on an experimental basis, denies that change on a national scale would be nearly as dramatic as that seen in New York. They estimate that that the NAS measure would yield a poverty rate between 12.2 and 14.1 percent for 2006, hardly much different than the 12.3 percent they have on the official books for that year. Additionally, while the poverty rate would go up in areas where the cost of housing is high (like New York City), it would not go up—and might even decrease—in areas with cheaper living options. The Census Bureau projects, for instance, that while California’s poverty rate would see an increase of 5 percentage points under the NAS line, Arkansas’s would see a decrease of the same size.
For some, the NAS line is simply too similar to the old line to bring much change. “The NAS approach improves on the current measure by taking certain work and health expenses into account,” explains Shawn Fremstad of the Center for Economic and Policy Research. “But it continues to measure poverty solely in terms of income.” Levitan agrees, calling the NAS line “a far superior income adequacy approach” to the existing method. “But one approach cannot capture everything that should be measured,” he says. “We should have a variety of approaches.”
One such approach comes out of Washington, D.C., where the Corporation for Enterprise Development (CFED) uses its own measure, called asset poverty, to assess economic wellbeing. According to the CFED’s definition of asset poverty, “a household is asset poor if it has insufficient net worth to subsist at the federal poverty level for three months in the absence of income.” Ida Rademacher, director of research at CFED, explains that “the current calculation of income poverty is inadequate to measure the costs and liabilities of everyday life…Income is one piece but you also need a family safety net.” The CFED uses asset-poverty data to rank the 50 states and the District of Columbia for that advocacy organizations to benchmark their performance.
In Georgia, the Self-Sufficiency Standard, developed in 2002 by University of Washington student Diana Pearce, offers another alternative for poverty measurement. The Self-Sufficiency Standard, like the NAS line before it, is geographically specific and takes into account housing, food, childcare, health care, taxes and other costs of living. Step Up Savannah, a collaborative of organizations, businesses, government agencies working towards sustainable poverty alleviation, uses the Self-Sufficiency Standard alongside official poverty statistics to measure the impact their partner organizations are having. According to Daniel Dodd, director of Step Up Savannah, they also measure success in terms of “community indicators,” like teen pregnancy and high-school dropout rates. Recognizing that Savannah lacks the “muscle” that bigger cities, like New York and San Francisco, have employed in their own anti-poverty campaigns, Dodd says, “We’re in the business of trying to come up with our own targets.” In a city where the official poverty rate has stagnated at a whopping 22% for the past 30 years, it seems that innovative approaches to poverty alleviation and poverty measurement are sorely needed.
It’s not clear where exactly the debate will go from here. Blank and Greenfield had hoped to “begin a new Administration with a measure that gives a more accurate picture of poverty before and after the recovery package and gives a clearer picture of what happens as unemployment goes up and down.” But more than half a year into the new Administration, the official measure still stands. Even as CEO-style impact studies make their way onto the agendas of cities and states, it might be some time before the poverty line becomes a political priority. Levitan predicts, “It will be a while before governments can refocus on poverty reduction.” And even then, he says, “An improved measure won’t, in itself, reduce poverty, but it will give us a far better understanding of the economic conditions of millions of Americans, and of what difference government policies make for large numbers of struggling families.”